Tested 2025-03-31 01:34:00 using Chrome 132.0.6834.83 (runtime settings).
| Metric | Value |
|---|---|
| Page metrics | |
| Performance score | 75 |
| Total page size | 2.4 MB |
| Requests | 54 |
| Timing metrics | |
| TTFB | 112 ms |
| First Paint | 290 ms |
| Fully Loaded | 1.389 s |
| Google Web Vitals | |
| TTFB | 112 ms |
| First Contentful Paint (FCP) | 290 ms |
| Largest Contentful Paint (LCP) | 798 ms |
| Cumulative Layout Shift (CLS) | 0.04 |
| Total Blocking Time | 147 ms |
| Max Potential FID | 124 ms |
| CPU metrics | |
| CPU long tasks | 7 |
| CPU last long task happens at | 1.408 s |
| Visual Metrics | |
| First Visual Change | 300 ms |
| Speed Index | 436 ms |
| Visual Complete 85% | 300 ms |
| Visual Complete 99% | 1.533 s |
| Last Visual Change | 1.533 s |

Use--filmstrip.showAll to show all filmstrips.
 0 s0.2 sCPU Long Task duration 59 ms
 0.3 sFirst Contentful Paint 290 msFirst Visual Change 300 msVisual Complete 85% 300 ms
 0.4 sLayout Shift 0.00088 332 msCPU Long Task duration 51 msHeading 367 ms
 0.5 sLayout Shift 0.00150 407 msLayout Shift 0.00002 449 msCPU Long Task duration 65 ms
 0.6 sCPU Long Task duration 124 ms
 0.9 sCPU Long Task duration 61 ms
 1 sCPU Long Task duration 56 ms
 1.1 sPage Load Time 1.033 s
 1.2 s
1.2 s 1.3 s
1.3 s 1.4 sVisual Complete 95% 1.333 sLargest Image 1.367 sFully Loaded 1.389 s
 1.5 sCPU Long Task duration 90 ms
 1.6 sLast Visual Change 1.533 sVisual Complete 99% 1.533 s
The coach helps you find performance problems on your web page using web performance best practice rules. And gives you advice on privacy and best practices. Tested using Coach-core version 8.1.1.

| Title | Advice | Score | ||||||||||||||||||||||||
|---|---|---|---|---|---|---|---|---|---|---|---|---|---|---|---|---|---|---|---|---|---|---|---|---|---|---|
| Avoid slowing down the critical rendering path (avoidRenderBlocking) | The page has 7 blocking requests and 3 in body parser blocking (5 JavaScript and 5 CSS). There are 2 potentially render blocking requests. You need to verify if they are render blocking: https://www.google.com/recaptcha/api.js?hl=fr https://www.googletagmanager.com/gtag/js?id=G-YP51KSLLWR | 48 | ||||||||||||||||||||||||
| Description: The critical rendering path is what the browser needs to do to start rendering the page. Every file requested inside of the head element will postpone the rendering of the page, because the browser need to do the request. Avoid loading JavaScript synchronously inside of the head (you should not need JavaScript to render the page), request files from the same domain as the main document (to avoid DNS lookups) and inline CSS for really fast rendering and a short rendering path. | ||||||||||||||||||||||||||
| Offenders: | ||||||||||||||||||||||||||
| Don't scale images in the browser (avoidScalingImages) | The page has 2 images that are scaled more than 100 pixels. It would be better if those images are sent so the browser don't need to scale them. | 80 | ||||||||||||||||||||||||
| Description: It's easy to scale images in the browser and make sure they look good in different devices, however that is bad for performance! Scaling images in the browser takes extra CPU time and will hurt performance on mobile. And the user will download extra kilobytes (sometimes megabytes) of data that could be avoided. Don't do that, make sure you create multiple version of the same image server-side and serve the appropriate one. | ||||||||||||||||||||||||||
| Offenders: | ||||||||||||||||||||||||||
| Avoid using Google Tag Manager. (googleTagManager) | The page is using Google Tag Manager, this is a performance risk since non-tech users can add JavaScript to your page. | 0 | ||||||||||||||||||||||||
| Description: Google Tag Manager makes it possible for non tech users to add scripts to your page that will downgrade performance. | ||||||||||||||||||||||||||
| Inline CSS for faster first render (inlineCss) | The page has both inline CSS and CSS requests even though it uses a HTTP/2-ish connection. If you have many users on slow connections, it can be better to only inline the CSS. Run your own tests and check the waterfall graph to see what happens. | 95 | ||||||||||||||||||||||||
| Description: In the early days of the Internet, inlining CSS was one of the ugliest things you can do. That has changed if you want your page to start rendering fast for your user. Always inline the critical CSS when you use HTTP/1 and HTTP/2 (avoid doing CSS requests that block rendering) and lazy load and cache the rest of the CSS. It is a little more complicated when using HTTP/2. Does your server support HTTP push? Then maybe that can help. Do you have a lot of users on a slow connection and are serving large chunks of HTML? Then it could be better to use the inline technique, becasue some servers always prioritize HTML content over CSS so the user needs to download the HTML first, before the CSS is downloaded. | ||||||||||||||||||||||||||
| Have a fast largest contentful paint (largestContentfulPaint) | You can add fetchPriority="high" to the image to increase the load priority in Chrome. | 95 | ||||||||||||||||||||||||
| Description: Largest contentful paint is one of Google Web Vitals and reports the render time of the largest image or text block visible within the viewport, relative to when the page first started loading. To be fast according to Google, it needs to render before 2.5 seconds and results over 4 seconds is poor performance. | ||||||||||||||||||||||||||
| Avoid CPU Long Tasks (longTasks) | The page has 7 CPU long tasks with the total of 506 ms. The total blocking time is 147 ms and 1 long task before first contentful paint with total time of 59 ms. However the CPU Long Task is depending on the computer/phones actual CPU speed, so you should measure this on the same type of the device that your user is using. Use Geckoprofiler for Firefox or Chromes tracelog to debug your long tasks. | 0 | ||||||||||||||||||||||||
| Description: Long CPU tasks locks the thread. To the user this is commonly visible as a "locked up" page where the browser is unable to respond to user input; this is a major source of bad user experience on the web today. However the CPU Long Task is depending on the computer/phones actual CPU speed, so you should measure this on the same type of the device that your user is using. To debug you should use the Chrome timeline log and drag/drop it into devtools or use Firefox Geckoprofiler. | ||||||||||||||||||||||||||
| Offenders: | ||||||||||||||||||||||||||
| Avoid extra requests by setting cache headers (cacheHeaders) | The page has 3 requests that are missing a cache time. Configure a cache time so the browser doesn't need to download them every time. It will save 45.1 kB the next access. | 70 | ||||||||||||||||||||||||
| Description: The easiest way to make your page fast is to avoid doing requests to the server. Setting a cache header on your server response will tell the browser that it doesn't need to download the asset again during the configured cache time! Always try to set a cache time if the content doesn't change for every request. | ||||||||||||||||||||||||||
| Offenders: | ||||||||||||||||||||||||||
| Long cache headers is good (cacheHeadersLong) | The page has 35 requests that have a shorter cache time than 30 days (but still a cache time). | 65 | ||||||||||||||||||||||||
| Description: Setting a cache header is good. Setting a long cache header (at least 30 days) is even better beacause then it will stay long in the browser cache. But what do you do if that asset change? Rename it and the browser will pick up the new version. | ||||||||||||||||||||||||||
| Offenders: | ||||||||||||||||||||||||||
| Total CSS size shouldn't be too big (cssSize) | The total CSS transfer size is 111.9 kB and uncompressed size is 423.3 kB. That is big and the CSS could most probably be smaller. | 50 | ||||||||||||||||||||||||
| Description: Delivering a massive amount of CSS to the browser is not the best thing you can do, because it means more work for the browser when parsing the CSS against the HTML and that makes the rendering slower. Try to send only the CSS that is used on that page. And make sure to remove CSS rules when they aren't used anymore. | ||||||||||||||||||||||||||
| Offenders: | ||||||||||||||||||||||||||
| Avoid too many fonts (fewFonts) | The page has 11 font requests. Do you really need them? What value does the fonts give the user? | 0 | ||||||||||||||||||||||||
| Description: How many fonts do you need on a page for the user to get the message? Fonts can slow down the rendering of content, try to avoid loading too many of them because worst case it can make the text invisible until they are loaded (FOIT—flash of invisible text), best case they will flicker the text content when they arrive. | ||||||||||||||||||||||||||
| Offenders: | ||||||||||||||||||||||||||
| Total JavaScript size shouldn't be too big (javascriptSize) | The total JavaScript transfer size is 616.3 kB and the uncompressed size is 1.6 MB. This is totally crazy! There is really room for improvement here. | 0 | ||||||||||||||||||||||||
| Description: A lot of JavaScript often means you are downloading more than you need. How complex is the page and what can the user do on the page? Do you use multiple JavaScript frameworks? | ||||||||||||||||||||||||||
Offenders:
| ||||||||||||||||||||||||||
| Make each CSS response small (optimalCssSize) | https://www.proantic.com/css/A.sweetalert2-v1-2.css+carrousel-09.css,,q20250314052139+fontawesome.min.css+regular.min.css+thin.min.css+sharp-solid.min.css,Mcc.3JL6I9dcBK.css.pagespeed.cf.Rz1MDGzIXY.css size is 39.5 kB (39527) and that is bigger than the limit of 14.5 kB. https://www.gstatic.com/recaptcha/releases/hbAq-YhJxOnlU-7cpgBoAJHb/styles__ltr.css size is 42.2 kB (42178) and that is bigger than the limit of 14.5 kB. Try to make the CSS files fit into 14.5 KB. | 80 | ||||||||||||||||||||||||
| Description: Make CSS responses small to fit into the magic number TCP window size of 14.5 KB. The browser can then download the CSS faster and that will make the page start rendering earlier. | ||||||||||||||||||||||||||
Offenders:
| ||||||||||||||||||||||||||
| Total page size shouldn't be too big (pageSize) | The page total transfer size is 2.5 MB, which is more than the coach limit of 2 MB. That is really big and you need to make it smaller. | 0 | ||||||||||||||||||||||||
| Description: Avoid having pages that have a transfer size over the wire of more than 2 MB (desktop) and 1 MB (mobile) because that is really big and will hurt performance and will make the page expensive for the user if she/he pays for the bandwidth. | ||||||||||||||||||||||||||
| Offenders: | ||||||||||||||||||||||||||
| Don't use private headers on static content (privateAssets) | The page has 2 requests with private headers. Make sure that the assets really should be private and only used by one user. Otherwise, make it cacheable for everyone. | 80 | ||||||||||||||||||||||||
| Description: If you set private headers on content, that means that the content are specific for that user. Static content should be able to be cached and used by everyone. Avoid setting the cache header to private. | ||||||||||||||||||||||||||
| Offenders: | ||||||||||||||||||||||||||
| Title | Advice | Score |
|---|---|---|
| Avoid using Google reCAPTCHA (googleReCaptcha) | You share your user data with Google since you use Google reCAPTCHA. | 0 |
| Description: You should avoid using Google reCAPTCHA since it will share your users information with Google. | ||
| Offenders: | ||
| Set a referrer-policy header to make sure you do not leak user information. (referrerPolicyHeader) | Set a referrer-policy header to make sure you do not leak user information. | 0 |
| Description: Referrer Policy is a new header that allows a site to control how much information the browser includes with navigations away from a document and should be set by all sites. https://scotthelme.co.uk/a-new-security-header-referrer-policy/. | ||
| Offenders: | ||
| Do not share user data with third parties. (thirdPartyPrivacy) | The page has 19% requests that are 3rd party (10 requests with a size of 688.2 kB). The page also have request to companies that harvest data from users and do not respect users privacy (see https://en.wikipedia.org/wiki/Surveillance_capitalism). The page do 3 utility requests and uses 1 utility tool. The page do 8 survelliance requests and uses 3 survelliance tools. The page do 1 tag-manager request and uses 1 tag-manager tool. The page do 1 marketing request and uses 1 marketing tool. | 0 |
| Description: Using third party requests shares user information with that third party. Please avoid that! The project https://github.com/patrickhulce/third-party-web is used to categorize first/third party requests. | ||
| Offenders: | ||
| Page info | |
|---|---|
| Title | Proantic: Antiquités Expertise Guillaume Rullier |
| Width | 1350 |
| Height | 6586 |
| DOM elements | 1463 |
| Avg DOM depth | 8 |
| Max DOM depth | 14 |
| Iframes | 3 |
| Script tags | 15 |
| Local storage | 0 b |
| Session storage | 0 b |
| Network Information API | 4g |
| Resource Hints |
|---|
| dns-prefetch |
| https://cdn-images.mailchimp.com/ |
| preconnect |
| https://cdn-images.mailchimp.com/ |
Data collected using Wappalyzer version 6.10.66. With updated code from Webappanalyzer 2024-12-27. Use --browsertime.firefox.includeResponseBodies htmlor --browsertime.chrome.includeResponseBodies htmlto help Wappalyzer find more information about technologies used.
| Technology | Confidence | Category |
|---|---|---|
| Amazon Web Services | 100 | PaaS |
| reCAPTCHA | 100 | Security |
| HSTS | 100 | Security |
| Google PageSpeed 1.13.35.2 | 100 | Caching Web server extensions Performance |
| Cloudflare | 100 | CDN |
| Amazon CloudFront | 100 | CDN |
| HTTP/3 | 100 | Miscellaneous |
Data collected using Third Party Web 0.26.2
| Utility |
|---|
| Other Google APIs/SDKs |
| Survelliance |
| Other Google APIs/SDKs |
| Google CDN |
| Google Tag Manager |
| Cdn |
| Google CDN |
| JSDelivr CDN |
| Tag-manager |
| Google Tag Manager |
| Marketing |
| Mailchimp |
| Visual Metrics | |
|---|---|
| First Visual Change | 300 ms |
| Speed Index | 436 ms |
| Largest Image | 1.367 s |
| Heading | 367 ms |
| LargestContentfulPaint | 1.367 s |
| Last Meaningful Paint | 1.367 s |
| Largest Contentful Paint | 1.367 s |
| Visual Complete 85% | 300 ms |
| Visual Complete 95% | 1.333 s |
| Visual Complete 99% | 1.533 s |
| Last Visual Change | 1.533 s |
| Visual Readiness | 1.233 s |
| Navigation Timing | |
|---|---|
| backEndTime | 112 ms |
| domContentLoadedTime | 706 ms |
| domInteractiveTime | 706 ms |
| domainLookupTime | 0 ms |
| frontEndTime | 919 ms |
| pageDownloadTime | 2 ms |
| pageLoadTime | 1.033 s |
| redirectionTime | 0 ms |
| serverConnectionTime | 17 ms |
| serverResponseTime | 93 ms |
| Google Web Vitals | |
|---|---|
| Time to first byte (TTFB) | 112 ms |
| First Contentful Paint (FCP) | 290 ms |
| Largest Contentful Paint (LCP) | 798 ms |
| Cumulative Layout Shift (CLS) | 0.04 |
| Total Blocking Time (TBT) | 147 ms |
| First Contentful Paint info | |
|---|---|
| Elements that needed recalculate style before FCP | 447 |
| Time spent in recalculate style before FCP | 23.601 ms |
| Extra timings | |
|---|---|
| TTFB | 112 ms |
| First Paint | 290 ms |
| Load Event End | 1.034 s |
| Fully loaded | 1.389 s |
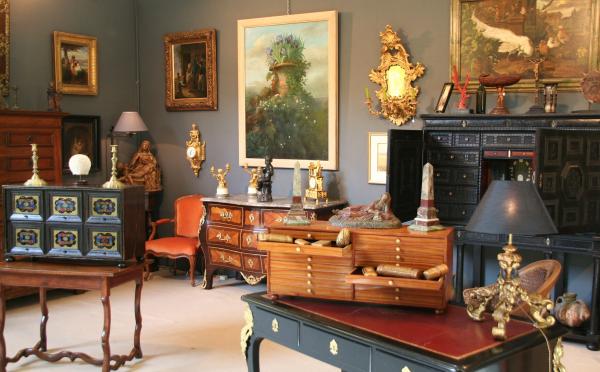
When in time the page main content is rendered (collected using the Largest Contentful Paint API). Read more about Largest Contentful Paint.
| Element type | IMG |
| Element/tag | <img class="img_carousel" src="https://www.proantic.com/galerie/guillaumerullier/indexImage.jpg" alt="guillaumerullier-diapo-1"> |
| Render time | 798 ms |
| Element render delay | 625 ms |
| TTFB | 112 ms |
| Resource delay | 14 ms |
| Resource load duration | 46 ms |
| Elements that needed recalculate style before LCP | 1417 |
| Time spent in recalculate style before LCP | 64.093 ms |
| Load time | 766 ms |
| URL | https://www.proantic...er/indexImage.jpg |
| Size (width*height) | 119110 |
| DOM path | |
| div#detail > div:eq(0) > div#ddetail > div#column-obj-left > div#slideshow-container > div:eq(1) > img> div#detail > div:eq(0) > div#ddetail > div#column-obj-left > div#slideshow-container > div:eq(1) > img> | |

The largest contentful paint is highlighted in the image. If no element is highlighted the element was removed before the screenshot or the LCP API couldn't find the element.
The Largest Contentful Paint API highlighted this image as a part of the LCP.
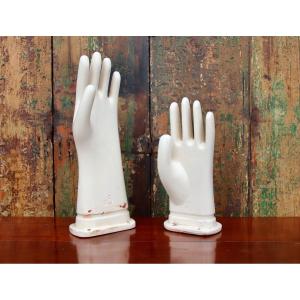
0.03818 cumulative layout shift collected from the Cumulative Layout Shift API.
These HTML elements contribute most to the Cumulative Layout Shifts of the page. The higher score, the more layout shift.
| Score | HTML Element |
|---|---|
| 0.03578 | <a class="prev" onclick="plusSlides(-1)"></a>,<a class="next" onclick="plusSlides(1)"></a>,<div class="main-text-antiquaires main-text desc toblur"></div>,<div class="h4-style toblur"></div>,<h2 class="h3-style antiquaire-subtitle toblur"></h2> |
| body > div#detail > div:eq(0) > div#ddetail > div#column-obj-left > div#slideshow-container > a:eq(0),body > div#detail > div:eq(0) > div#ddetail > div#column-obj-left > div#slideshow-container > a:eq(1),body > div#detail > div:eq(0) > div#ddetail > div#column-obj-left > div:eq(2),body > div#detail > div:eq(0) > div#ddetail > div#column-obj-left > div:eq(1),body > div#detail > div:eq(0) > div#ddetail > div#column-obj-left > h2 | |
| 0.00150 | <div class="w-dropdown-nav nav-menu-hover nav-menu-hover-meta" onclick=""></div>,,<div class="w-dropdown-nav nav-menu-hover nav-menu-hover-meta" data-menu="antiquaire"></div>,<div class="w-dropdown-nav nav-menu-hover nav-menu-hover-meta" onclick=""></div>, |
| body > div#totop > div > div#new-menu-top > nav > div:eq(6),body > div#detail > div:eq(0) > div:eq(0) > div:eq(0) > div > #text,body > div#totop > div > div#new-menu-top > nav > div:eq(7),body > div#totop > div > div#new-menu-top > nav > div:eq(3),body > div#detail > div:eq(0) > div#ddetail > div:eq(1) > div > div > div:eq(0) > div:eq(2) > #text:eq(1) | |
| 0.00088 | |
| body > div#detail > div:eq(0) > div:eq(0) > h1 > #text | |
| 0.00002 | <button type="submit" style="border: none;background: none" aria-label="Que recherchez-vous ?"></button>,<a class="next" onclick="plusSlides(1)"></a> |
| body > div#totop > div > div#new-menu-top > div:eq(0) > div:eq(2) > form > button,body > div#detail > div:eq(0) > div#ddetail > div#column-obj-left > div#slideshow-container > a:eq(1) | |

The elements that have shifted place is highlighted in the image (that have a higher value than 0.01). If the element shifted outside of the viewport, you will not see it there. It can be hard to understand what content that has shifted, if that's the case, checkout the video or the filmstrip of the run.
Read more about the Long Animation Frames API here here.
The top 10 longest animation frames entries
| Blocking duration | Work duration | Render duration | PreLayout Duration | Style And Layout Duration |
|---|---|---|---|---|
| 75 ms | 125.8 ms | 0.2 ms | 0.1 ms | 0.1 ms |
| https://www.googletagmanager.com/gtag/js?id=G-YP51KSLLWR | ||||
Invoker: https://www.googletagmanager.com/gtag/js?id=G-YP51KSLLWR | ||||
| Blocking duration | Work duration | Render duration | PreLayout Duration | Style And Layout Duration |
|---|---|---|---|---|
| 42 ms | 90.9 ms | 2.1 ms | 0.1 ms | 2 ms |
| No availible script information. | ||||
| Blocking duration | Work duration | Render duration | PreLayout Duration | Style And Layout Duration |
|---|---|---|---|---|
| 28 ms | 77.1 ms | 11.9 ms | 11.2 ms | 0.7 ms |
| https://www.gstatic.com/recaptcha/releases/hbAq-YhJxOnlU-7cpgBoAJHb/recaptcha__fr.js | ||||
Invoker: https://www.gstatic.com/recaptcha/releases/hbAq-YhJxOnlU-7cpgBoAJHb/recaptcha__fr.js | ||||
| Blocking duration | Work duration | Render duration | PreLayout Duration | Style And Layout Duration |
|---|---|---|---|---|
| 25 ms | 68.2 ms | 58.8 ms | 0 ms | 58.8 ms |
| No availible script information. | ||||
| Blocking duration | Work duration | Render duration | PreLayout Duration | Style And Layout Duration |
|---|---|---|---|---|
| 17 ms | 22.8 ms | 50.2 ms | 46.8 ms | 3.4 ms |
| No availible script information. | ||||
| Blocking duration | Work duration | Render duration | PreLayout Duration | Style And Layout Duration |
|---|---|---|---|---|
| 14 ms | 71.1 ms | 1.9 ms | 1.6 ms | 0.3 ms |
| No availible script information. | ||||
| Blocking duration | Work duration | Render duration | PreLayout Duration | Style And Layout Duration |
|---|---|---|---|---|
| 9 ms | 56.6 ms | 2.4 ms | 1.6 ms | 0.8 ms |
| No availible script information. | ||||
| Blocking duration | Work duration | Render duration | PreLayout Duration | Style And Layout Duration |
|---|---|---|---|---|
| 0 ms | 60.3 ms | 1.7 ms | 0.2 ms | 1.5 ms |
| https://www.gstatic.com/recaptcha/releases/hbAq-YhJxOnlU-7cpgBoAJHb/recaptcha__fr.js | ||||
Invoker: MessagePort.onmessage | ||||
| Blocking duration | Work duration | Render duration | PreLayout Duration | Style And Layout Duration |
|---|---|---|---|---|
| 0 ms | 53.3 ms | 1.7 ms | 0.2 ms | 1.5 ms |
| No availible script information. | ||||
There are no Server Timings.
There are no custom configured scripts.
There are no custom extra metrics from scripting.
| name | value |
|---|---|
| AudioHandlers | 0 |
| AudioWorkletProcessors | 0 |
| Documents | 5 |
| Frames | 5 |
| JSEventListeners | 94 |
| LayoutObjects | 2077 |
| MediaKeySessions | 0 |
| MediaKeys | 0 |
| Nodes | 4932 |
| Resources | 208 |
| ContextLifecycleStateObservers | 16 |
| V8PerContextDatas | 5 |
| WorkerGlobalScopes | 1 |
| UACSSResources | 0 |
| RTCPeerConnections | 0 |
| ResourceFetchers | 7 |
| AdSubframes | 0 |
| DetachedScriptStates | 2 |
| ArrayBufferContents | 99 |
| LayoutCount | 27 |
| RecalcStyleCount | 75 |
| LayoutDuration | 115 |
| RecalcStyleDuration | 75 |
| DevToolsCommandDuration | 44 |
| ScriptDuration | 671 |
| V8CompileDuration | 27 |
| TaskDuration | 1451 |
| TaskOtherDuration | 520 |
| ThreadTime | 1 |
| ProcessTime | 2 |
| JSHeapUsedSize | 13235460 |
| JSHeapTotalSize | 27549696 |
| FirstMeaningfulPaint | 290 |
| Name | Display Time | X | Y | Width | Height |
|---|---|---|---|---|---|
| LargestImage (indexImage.jpg) | 1.367 s | 93 | 405 | 555 | 344 |
| <img class="img_carousel" src="https://www.proantic.com/galerie/guillaumerullier/indexImage.jpg" alt="guillaumerullier-diapo-1"> | |||||
| Heading | 367 ms | 75 | 190 | 1200 | 44 |
| <h1 class="h1-style h1-accueil toblur"></h1> | |||||
| LargestContentfulPaint (indexImage.jpg) | 1.367 s | 93 | 405 | 555 | 344 |
| <img class="img_carousel" src="https://www.proantic.com/galerie/guillaumerullier/indexImage.jpg" alt="guillaumerullier-diapo-1"> | |||||
How the page is built.
| Summary | |
|---|---|
| HTTP version | HTTP/2.0 |
| Total requests | 54 |
| Total domains | 7 |
| Total transfer size | 2.4 MB |
| Total content size | 3.8 MB |
| Responses missing compression | 15 |
| Number of cookies | 0 |
| Third party cookies | 0 |
| Requests per response code | |
|---|---|
| 200 | 54 |
| Content | Header Size | Transfer Size | Content Size | Requests |
|---|---|---|---|---|
| html | 0 b | 71.1 KB | 255.6 KB | 3 |
| css | 0 b | 109.3 KB | 413.4 KB | 7 |
| javascript | 0 b | 601.8 KB | 1.5 MB | 7 |
| image | 0 b | 662.3 KB | 653.5 KB | 26 |
| font | 0 b | 1017.6 KB | 1013.2 KB | 11 |
| Total | 0 b | 2.4 MB | 3.8 MB | 54 |
| Domain | Total download time | Transfer Size | Content Size | Requests |
|---|---|---|---|---|
| www.proantic.com | 1.917 s | 1.7 MB | 2.2 MB | 44 |
| www.google.com | 117 ms | 43.8 KB | 81.5 KB | 3 |
| ajax.googleapis.com | 42 ms | 30.9 KB | 87.4 KB | 1 |
| cdn.jsdelivr.net | 46 ms | 2.3 KB | 4.3 KB | 1 |
| www.googletagmanager.com | 61 ms | 115.3 KB | 336.3 KB | 1 |
| www.gstatic.com | 104 ms | 478.6 KB | 1.2 MB | 3 |
| cdn-images.mailchimp.com | 9 ms | 1.2 KB | 2.0 KB | 1 |
| type | min | median | max |
|---|---|---|---|
| Expires | 0 seconds | 1 week | 1 year |
| Last modified | 2 days | 2 weeks | 15 years |
Included requests done after load event end.
| Content | Transfer Size | Requests |
|---|---|---|
| html | 1.2 KB | 1 |
| css | 0 b | 0 |
| javascript | 0 b | 0 |
| image | 88.5 KB | 1 |
| font | 0 b | 0 |
| Total | 89.7 KB | 2 |
Includes requests done after DOM content loaded.
| Content | Transfer Size | Requests |
|---|---|---|
| html | 42.8 KB | 2 |
| css | 41.2 KB | 1 |
| javascript | 218.7 KB | 1 |
| image | 88.5 KB | 1 |
| font | 0 b | 0 |
| Total | 391.2 KB | 5 |
Render blocking information directly from Chrome.
| Blocking | In body parser blocking | Potentially blocking |
|---|---|---|
| 7 | 3 | 2 |
Download the Chrome trace log and drag and drop it into Developer Tools / Performance in Chrome.
Collected using the Long Task API. A long task is a task that take 50 milliseconds or more.
| Type | Quantity | Total duration (ms) |
|---|---|---|
| Total Blocking Time | 147 | |
| Max Potential First Input Delay | 124 | |
| Long Tasks before First Paint | 1 | 59 |
| Long Tasks before First Contentful Paint | 1 | 59 |
| Long Tasks before Largest Contentful Paint | 4 | 299 |
| Long Tasks after Load Event End | 1 | 90 |
| Total Long Tasks | 7 | 506 |
CPU last long task happened at 1.408 s
| name | startTime | duration | containerId | containerName | containerSrc | containerType |
|---|---|---|---|---|---|---|
| unknown | 184 | 59 | window | |||
| unknown | 361 | 51 | window | |||
| self | 467 | 65 | window | |||
| self | 547 | 124 | window | |||
| cross-origin-descendant | 845 | 61 | a-3r9y6vipbwc9 | https://www.google.com/recaptcha/api2/anchor?ar=1&k=6LcfATsUAAAAAImvdo_R-wH2rudDFIBaTKHxOd3Q&co=aHR0cHM6Ly93d3cucHJvYW50aWMuY29tOjQ0Mw..&hl=fr&v=hbAq-YhJxOnlU-7cpgBoAJHb&size=normal&cb=xkmr0gezqp35 | iframe | |
| cross-origin-descendant | 910 | 56 | a-3r9y6vipbwc9 | https://www.google.com/recaptcha/api2/anchor?ar=1&k=6LcfATsUAAAAAImvdo_R-wH2rudDFIBaTKHxOd3Q&co=aHR0cHM6Ly93d3cucHJvYW50aWMuY29tOjQ0Mw..&hl=fr&v=hbAq-YhJxOnlU-7cpgBoAJHb&size=normal&cb=xkmr0gezqp35 | iframe | |
| cross-origin-descendant | 1408 | 90 | c-3r9y6vipbwc9 | https://www.google.com/recaptcha/api2/bframe?hl=fr&v=hbAq-YhJxOnlU-7cpgBoAJHb&k=6LcfATsUAAAAAImvdo_R-wH2rudDFIBaTKHxOd3Q | iframe |
Calculated using Tracium.
| Categories (ms) | |
|---|---|
| parseHTML | 120 |
| styleLayout | 193 |
| paintCompositeRender | 34 |
| scriptParseCompile | 27 |
| scriptEvaluation | 732 |
| garbageCollection | 77 |
| other | 235 |
| Events (ms) | |
|---|---|
| v8.run | 313 |
| FunctionCall | 248 |
| RunTask | 159 |
| Layout | 115 |
| RunMicrotasks | 86 |
| UpdateLayoutTree | 78 |
| ParseHTML | 69 |
| V8.GC_SCAVENGER_SCAVENGE_UPDATE_REFS | 60 |
| HTMLDocumentParser::MaybeFetchQueuedPreloads | 43 |
| Paint | 27 |
| v8.compile | 27 |
| V8.BytecodeBudgetInterrupt | 21 |
| TimerFire | 19 |
| ParseAuthorStyleSheet | 13 |
| PrePaint | 12 |
| v8.callFunction | 11 |
| DocumentLoader::CommitNavigation | 11 |
| Tool/domain | Time (ms) |
|---|---|
| Google CDN | 465.7 |
| Google Tag Manager | 154.5 |
| Other Google APIs/SDKs | 65.3 |
Third party requests categorised by Third party web version 0.26.2.
| Category | Requests |
|---|---|
| utility | 3 |
| survelliance | 8 |
| cdn | 5 |
| tag-manager | 1 |
| marketing | 1 |
| Category | Number of tools |
|---|---|
| utility | 1 |
| survelliance | 3 |
| cdn | 2 |
| tag-manager | 1 |
| marketing | 1 |
Calculated using .*proantic.* (use --firstParty to configure).
| Content | Header Size | Transfer Size | Content Size | Requests |
|---|---|---|---|---|
| html | 0 b | 28.2 KB | 175.5 KB | 1 |
| css | 0 b | 66.9 KB | 334.6 KB | 5 |
| javascript | 0 b | 15.0 KB | 47.2 KB | 1 |
| image | 0 b | 662.3 KB | 653.5 KB | 26 |
| font | 0 b | 1017.6 KB | 1013.2 KB | 11 |
| Total | N/A | 1.7 MB | 2.2 MB | 44 |
| Content | Header Size | Transfer Size | Content Size | Requests |
|---|---|---|---|---|
| html | 0 b | 42.8 KB | 80.0 KB | 2 |
| css | 0 b | 42.4 KB | 78.8 KB | 2 |
| javascript | 0 b | 586.8 KB | 1.5 MB | 6 |
| image | 0 b | 0 b | 0 b | 0 |
| font | 0 b | 0 b | 0 b | 0 |
| Total | N/A | 672.0 KB | 1.7 MB | 10 |

afterPageCompleteCheck.png

layoutShift.png

largestContentfulPaint.png
Axe is an accessibility testing engine for websites and other HTML-based user interfaces. Tested using axe-core version 4.10.2. Read more about axe-core .
| serious | |
|---|---|
| Elements must meet minimum color contrast ratio thresholds (cat.color,wcag2aa,wcag143,TTv5,TT13.c,EN-301-549,EN-9.1.4.3,ACT) - color-contrast | Ensure the contrast between foreground and background colors meets WCAG 2 AA minimum contrast ratio thresholds |
Fix any of the following:
Element has insufficient color contrast of 2.68 (foreground color: #bc9956, background color: #ffffff, font size: 24.0pt (32px), font weight: normal). Expected contrast ratio of 3:1
| |
| Form elements should have a visible label (cat.forms,best-practice) - label-title-only | Ensure that every form element has a visible label and is not solely labeled using hidden labels, or the title or aria-describedby attributes |
Fix all of the following:
Only title used to generate label for form element
| |
| moderate | |
| Document should have one main landmark (cat.semantics,best-practice) - landmark-one-main | Ensure the document has a main landmark |
Fix all of the following:
Document does not have a main landmark
| |
| serious | |
| Links must have discernible text (cat.name-role-value,wcag2a,wcag244,wcag412,section508,section508.22.a,TTv5,TT6.a,EN-301-549,EN-9.2.4.4,EN-9.4.1.2,ACT) - link-name | Ensure links have discernible text |
Fix all of the following:
Element is in tab order and does not have accessible text
Fix any of the following:
Element does not have text that is visible to screen readers
aria-label attribute does not exist or is empty
aria-labelledby attribute does not exist, references elements that do not exist or references elements that are empty
Element has no title attribute
| |
| moderate | |
| All page content should be contained by landmarks (cat.keyboard,best-practice) - region | Ensure all page content is contained by landmarks |
Fix any of the following:
Some page content is not contained by landmarks
| |
