Tested 2026-03-14 02:40:39 using Chrome 132.0.6834.83 (runtime settings).
| Metric | Value |
|---|---|
| Page metrics | |
| Performance Score | 68 |
| Total Page Transfer Size | 4.7 MB |
| Requests | 73 |
| Timing metrics | |
| TTFB [median] | 159 ms |
| First Paint [median] | 372 ms |
| Fully Loaded [median] | 1.089 s |
| Google Web Vitals | |
| TTFB [median] | 159 ms |
| First Contentful Paint (FCP) [median] | 372 ms |
| Largest Contentful Paint (LCP) [median] | 718 ms |
| Cumulative Layout Shift (CLS) [median] | 0.00 |
| Interaction To Next Paint (INP) [median] | 280 ms |
| Total Blocking Time [median] | 52 ms |
| Max Potential FID [median] | 89 ms |
| CPU metrics | |
| CPU long tasks [median] | 3 |
| CPU longest task duration | 148 ms |
| CPU last long task happens at | 829 ms |
| Visual Metrics | |
| First Visual Change [median] | 367 ms |
| Speed Index [median] | 649 ms |
| Visual Complete 85% [median] | 734 ms |
| Visual Complete 99% [median] | 1.033 s |
| Last Visual Change [median] | 1.033 s |

| Metric | min | median | mean | max |
|---|---|---|---|---|
| Visual Metrics | ||||
| FirstVisualChange | 367 ms | 367 ms | 489 ms | 734 ms |
| LastVisualChange | 834 ms | 1.033 s | 1.145 s | 1.567 s |
| SpeedIndex | 480 ms | 649 ms | 630 ms | 762 ms |
| LargestImage | 600 ms | 734 ms | 734 ms | 867 ms |
| Heading | 600 ms | 767 ms | 722 ms | 800 ms |
| LargestContentfulPaint | 600 ms | 767 ms | 722 ms | 800 ms |
| LastMeaningfulPaint | 600 ms | 767 ms | 745 ms | 867 ms |
| VisualReadiness | 467 ms | 666 ms | 655 ms | 833 ms |
| VisualComplete85 | 500 ms | 734 ms | 678 ms | 800 ms |
| VisualComplete95 | 634 ms | 767 ms | 756 ms | 867 ms |
| VisualComplete99 | 834 ms | 1.033 s | 1.111 s | 1.467 s |
| Google Web Vitals | ||||
| Time To First Byte (TTFB) | 114 ms | 159 ms | 146 ms | 165 ms |
| Largest Contentful Paint (LCP) | 587 ms | 718 ms | 702 ms | 800 ms |
| First Contentful Paint (FCP) | 343 ms | 372 ms | 478 ms | 718 ms |
| Cumulative Layout Shift (CLS) | 0.0028 | 0.0028 | 0.0028 | 0.0028 |
| More metrics | ||||
| firstPaint | 343 ms | 372 ms | 478 ms | 718 ms |
| loadEventEnd | 798 ms | 1.065 s | 1.128 s | 1.521 s |
| CPU | ||||
| Total Blocking Time | 39 ms | 52 ms | 66 ms | 108 ms |
| Max Potential FID | 88 ms | 89 ms | 93 ms | 102 ms |
| CPU long tasks | 2 | 3 | 3 | 4 |
| CPU last long task happens at | 663 ms | 829 ms | 814 ms | 949 ms |
Run 3 SpeedIndex median
Use--filmstrip.showAll to show all filmstrips.
 0 s
0 s 0.4 sFirst Visual Change 367 msFirst Contentful Paint 372 ms
 0.5 sCPU Long Task duration 102 msDOM Content Loaded Time 402 ms
 0.6 sCPU Long Task duration 70 ms
 0.7 sLayout Shift 0.00285 686 ms
 0.8 sLCP <DIV> 800 msVisual Complete 85% 800 msHeading 800 ms
 0.9 sVisual Complete 95% 867 msLargest Image 867 ms1 sCPU Long Task duration 86 ms
 1.1 sLast Visual Change 1.033 sVisual Complete 99% 1.033 sPage Load Time 1.064 sFully Loaded 1.089 s
The coach helps you find performance problems on your web page using web performance best practice rules. And gives you advice on privacy and best practices. Tested using Coach-core version 8.1.1.

| Title | Advice | Score |
|---|---|---|
| Avoid unnecessary headers (unnecessaryHeaders) | There are 73 responses that sets both a max-age and expires header. There are 9 responses that sets a pragma no-cache header (that is a request header). There are 73 responses that sets a server header. | 0 |
| Description: Do not send headers that you don't need. We look for p3p, cache-control and max-age, pragma, server and x-frame-options headers. Have a look at Andrew Betts - Headers for Hackers talk as a guide https://www.youtube.com/watch?v=k92ZbrY815c or read https://www.fastly.com/blog/headers-we-dont-want. | ||
| Offenders: | ||
| Title | Advice | Score |
|---|---|---|
| Avoid using Google Analytics (ga) | The page is using Google Analytics meaning you share your users private information with Google. You should use analytics that care about user privacy, something like https://matomo.org. | 0 |
| Description: Google Analytics share private user information with Google that your user hasn't agreed on sharing. | ||
| Use a good Content-Security-Policy header to make sure you you avoid Cross Site Scripting (XSS) attacks. (contentSecurityPolicyHeader) | Set a Content-Security-Policy header to make sure you are not open for Cross Site Scripting (XSS) attacks. You can start with setting a Content-Security-Policy-Report-Only header, that will only report the violation, not stop the download. | 0 |
| Description: Content Security Policy is delivered via a HTTP response header, and defines approved sources of content that the browser may load. It can be an effective countermeasure to Cross Site Scripting (XSS) attacks and is also widely supported and usually easily deployed. https://scotthelme.co.uk/content-security-policy-an-introduction/. | ||
| Offenders: | ||
| Set a referrer-policy header to make sure you do not leak user information. (referrerPolicyHeader) | Set a referrer-policy header to make sure you do not leak user information. | 0 |
| Description: Referrer Policy is a new header that allows a site to control how much information the browser includes with navigations away from a document and should be set by all sites. https://scotthelme.co.uk/a-new-security-header-referrer-policy/. | ||
| Offenders: | ||
| Do not share user data with third parties. (thirdPartyPrivacy) | The page has 5% requests that are 3rd party (4 requests with a size of 184 kB). The page also have request to companies that harvest data from users and do not respect users privacy (see https://en.wikipedia.org/wiki/Surveillance_capitalism). The page do 3 analytics requests and uses 1 analytics tool. The page do 4 survelliance requests and uses 2 survelliance tools. The page do 1 tag-manager request and uses 1 tag-manager tool. | 0 |
| Description: Using third party requests shares user information with that third party. Please avoid that! The project https://github.com/patrickhulce/third-party-web is used to categorize first/third party requests. | ||
| Offenders: | ||
| Page info | |
|---|---|
| Title | Antiquités en France, le guide des antiquaires |
| Width | 1354 |
| Height | 3035 |
| DOM elements | 477 |
| Avg DOM depth | 10 |
| Max DOM depth | 16 |
| Iframes | 0 |
| Script tags | 11 |
| Local storage | 0 b |
| Session storage | 0 b |
| Network Information API | 4g |
Data collected using Wappalyzer version 6.10.66. With updated code from Webappanalyzer 2024-12-27. Use --browsertime.firefox.includeResponseBodies htmlor --browsertime.chrome.includeResponseBodies htmlto help Wappalyzer find more information about technologies used.
| Technology | Confidence | Category |
|---|---|---|
| PHP 7.0 | 100 | Programming languages |
| HSTS | 100 | Security |
| HTTP/3 | 100 | Miscellaneous |
Data collected using Third Party Web 0.26.2
| Analytics |
|---|
| Google Analytics |
| Survelliance |
| Google Analytics |
| Google Tag Manager |
| Tag-manager |
| Google Tag Manager |
Data from run 3
| Visual Metrics | |
|---|---|
| First Visual Change | 367 ms |
| Speed Index | 649 ms |
| Largest Image | 867 ms |
| Heading | 800 ms |
| LargestContentfulPaint | 800 ms |
| Last Meaningful Paint | 867 ms |
| Largest Contentful Paint | 800 ms |
| Visual Complete 85% | 800 ms |
| Visual Complete 95% | 867 ms |
| Visual Complete 99% | 1.033 s |
| Last Visual Change | 1.033 s |
| Visual Readiness | 666 ms |
| Navigation Timing | |
|---|---|
| backEndTime | 165 ms |
| domContentLoadedTime | 402 ms |
| domInteractiveTime | 402 ms |
| domainLookupTime | 1 ms |
| frontEndTime | 898 ms |
| pageDownloadTime | 2 ms |
| pageLoadTime | 1.064 s |
| redirectionTime | 0 ms |
| serverConnectionTime | 16 ms |
| serverResponseTime | 145 ms |
| Google Web Vitals | |
|---|---|
| Time to first byte (TTFB) | 165 ms |
| First Contentful Paint (FCP) | 372 ms |
| Largest Contentful Paint (LCP) | 800 ms |
| Cumulative Layout Shift (CLS) | 0.00 |
| Total Blocking Time (TBT) | 108 ms |
| First Contentful Paint info | |
|---|---|
| Elements that needed recalculate style before FCP | 260 |
| Time spent in recalculate style before FCP | 20.29 ms |
| Extra timings | |
|---|---|
| TTFB | 165 ms |
| First Paint | 372 ms |
| Load Event End | 1.065 s |
| Fully loaded | 1.089 s |
When in time the page main content is rendered (collected using the Largest Contentful Paint API). Read more about Largest Contentful Paint.
| Element type | DIV |
| Element/tag | <div class="texture-content-1"></div> |
| Render time | 800 ms |
| Element render delay | 158 ms |
| TTFB | 165 ms |
| Resource delay | 154 ms |
| Resource load duration | 323 ms |
| Elements that needed recalculate style before LCP | 606 |
| Time spent in recalculate style before LCP | 39.499 ms |
| Load time | 654 ms |
| URL | https://www.antiquit...ure-content-1.png |
| Size (width*height) | 78384 |
| DOM path | |
| div:eq(3) > div:eq(0) > div > div > div> div:eq(3) > div:eq(0) > div > div > div> | |
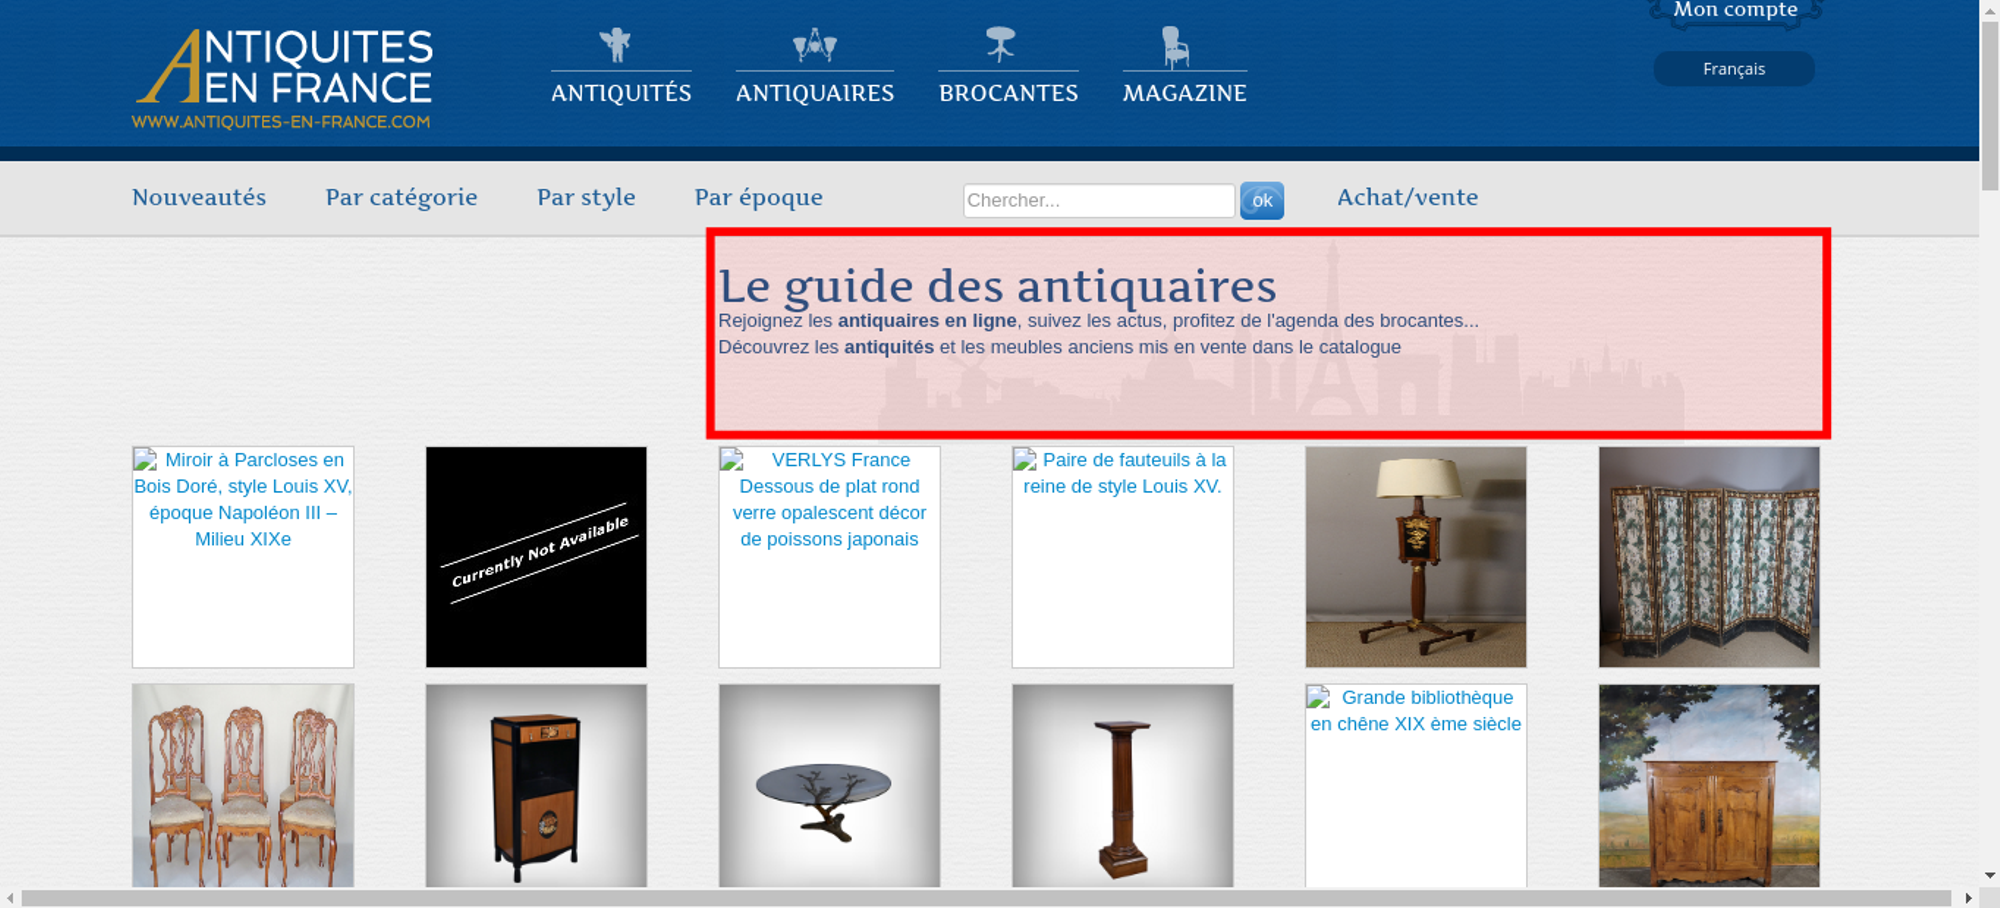
The largest contentful paint is highlighted in the image. If no element is highlighted the element was removed before the screenshot or the LCP API couldn't find the element.
The Largest Contentful Paint API highlighted this image as a part of the LCP.

0.00285 cumulative layout shift collected from the Cumulative Layout Shift API.
These HTML elements contribute most to the Cumulative Layout Shifts of the page. The higher score, the more layout shift.
| Score | HTML Element |
|---|---|
| 0.00285 | <li class="menu-item"></li>,<ul class="sub-menu second-sub-menu"></ul>,<li class="menu-item "></li>,<div class="block-search"></div>,<li class="menu-item"></li> |
| body > div:eq(0) > div > div > div > div > ul > li:eq(1),body > div#jz-header > div#jz-container > div > div > ul:eq(1),body > div:eq(0) > div > div > div > div > ul > li:eq(2),body > div#jz-header > div#jz-container > div > div > div,body > div:eq(0) > div > div > div > div > ul > li:eq(3) | |

The elements that have shifted place is highlighted in the image (that have a higher value than 0.01). If the element shifted outside of the viewport, you will not see it there. It can be hard to understand what content that has shifted, if that's the case, checkout the video or the filmstrip of the run.
Read more about the Long Animation Frames API here here.
The top 10 longest animation frames entries
| Blocking duration | Work duration | Render duration | PreLayout Duration | Style And Layout Duration |
|---|---|---|---|---|
| 55 ms | 108.4 ms | 2.6 ms | 1.2 ms | 1.4 ms |
| https://www.antiquites-en-france.com/js/jquery.min.js | ||||
Forced Style And Layout Duration: 89 ms Invoker: #document.onDOMContentLoaded | ||||
| Blocking duration | Work duration | Render duration | PreLayout Duration | Style And Layout Duration |
|---|---|---|---|---|
| 38 ms | 103 ms | 2 ms | 1.5 ms | 0.5 ms |
| https://www.googletagmanager.com/gtag/js?id=G-58XGFJWZ1E&cx=c&_slc=1 | ||||
Invoker: https://www.googletagmanager.com/gtag/js?id=G-58XGFJWZ1E&cx=c&_slc=1 | ||||
| Blocking duration | Work duration | Render duration | PreLayout Duration | Style And Layout Duration |
|---|---|---|---|---|
| 20 ms | 70 ms | 0 ms | 0 ms | 0 ms |
| https://www.google-analytics.com/analytics.js | ||||
Invoker: https://www.google-analytics.com/analytics.js | ||||
| Blocking duration | Work duration | Render duration | PreLayout Duration | Style And Layout Duration |
|---|---|---|---|---|
| 0 ms | 134.8 ms | 0.2 ms | 0.8 ms | -0.6 ms |
| https://www.antiquites-en-france.com/js/jquery.min.js | ||||
Invoker: https://www.antiquites-en-france.com/js/jquery.min.js | ||||
| https://www.antiquites-en-france.com/vendor/jquery-ui/js/jquery-ui-1.8.22.custom.min.js | ||||
Forced Style And Layout Duration: 3 ms Invoker: https://www.antiquites-en-france.com/vendor/jquery-ui/js/jquery-ui-1.8.22.custom.min.js | ||||
| https://www.antiquites-en-france.com/galleria/galleriacustom.min.js | ||||
Invoker: https://www.antiquites-en-france.com/galleria/galleriacustom.min.js | ||||
| Blocking duration | Work duration | Render duration | PreLayout Duration | Style And Layout Duration |
|---|---|---|---|---|
| 0 ms | 74.2 ms | 1.8 ms | 1.2 ms | 0.6 ms |
| https://www.antiquites-en-france.com/galleria/galleriacustom.min.js | ||||
Invoker: TimerHandler:setTimeout | ||||
| https://www.antiquites-en-france.com/galleria/galleriacustom.min.js | ||||
Forced Style And Layout Duration: 3 ms Invoker: TimerHandler:setTimeout | ||||
| https://www.antiquites-en-france.com/galleria/galleriacustom.min.js | ||||
Forced Style And Layout Duration: 2 ms Invoker: TimerHandler:setTimeout | ||||
| Blocking duration | Work duration | Render duration | PreLayout Duration | Style And Layout Duration |
|---|---|---|---|---|
| 0 ms | 59.6 ms | 2.4 ms | 0.6 ms | 1.8 ms |
| https://www.antiquites-en-france.com/galleria/galleriacustom.min.js | ||||
Forced Style And Layout Duration: 7 ms Invoker: TimerHandler:setTimeout | ||||
| https://www.antiquites-en-france.com/galleria/galleriacustom.min.js | ||||
Forced Style And Layout Duration: 1 ms Invoker: TimerHandler:setTimeout | ||||
| https://www.antiquites-en-france.com/galleria/galleriacustom.min.js | ||||
Forced Style And Layout Duration: 4 ms Invoker: TimerHandler:setTimeout | ||||
| https://www.antiquites-en-france.com/galleria/galleriacustom.min.js | ||||
Forced Style And Layout Duration: 5 ms Invoker: TimerHandler:setTimeout | ||||
There are no Server Timings.
There are no custom configured scripts.
There are no custom extra metrics from scripting.
| Name | Display Time | X | Y | Width | Height |
|---|---|---|---|---|---|
| LargestImage (0.jpg) | 867 ms | 291 | 305 | 150 | 150 |
| <img width="150px" height="150px" src="/uploads/items/thumb_blank/0.jpg" alt="Lampe de la Maison Charles"> | |||||
| Heading | 800 ms | 490 | 180 | 770 | 30 |
| <h1></h1> | |||||
| LargestContentfulPaint | 800 ms | 490 | 162 | 770 | 142 |
| <div class="texture-content-1"></div> | |||||
How the page is built.
| Summary | |
|---|---|
| HTTP version | HTTP/2.0 |
| Total requests | 73 |
| Total domains | 4 |
| Total transfer size | 4.7 MB |
| Total content size | 5.4 MB |
| Responses missing compression | 19 |
| Number of cookies | 1 |
| Third party cookies | 0 |
| Requests per response code | |
|---|---|
| 200 | 68 |
| 204 | 1 |
| 404 | 4 |
| URL | Type | Transfer Size | Content Size |
|---|---|---|---|
| https://www.antiquit...e681ba4f42465.jpg | image | 768.8 KB | 767.7 KB |
| https://www.antiquit...7c6678c3710b1.jpg | image | 528.1 KB | 527.2 KB |
| https://www.antiquit...f75f7adc72b55.jpg | image | 510.1 KB | 509.3 KB |
| https://www.antiquit...94141ca4106bf.jpg | image | 338.0 KB | 337.4 KB |
| https://www.antiquit...6970f3cb22680.jpg | image | 319.1 KB | 318.5 KB |
| https://www.antiquit...da8dc8bd53e5b.jpg | image | 302.4 KB | 301.8 KB |
| https://www.antiquit...0ee6ae5d1f372.jpg | image | 206.8 KB | 206.4 KB |
| https://www.googleta...nager.com/gtag/js | javascript | 158.3 KB | 465.3 KB |
| https://www.antiquit...8a2c1d8279b7d.jpg | image | 153.6 KB | 153.2 KB |
| https://www.antiquit...c0675250696bc.jpg | image | 151.5 KB | 151.1 KB |
| https://www.antiquit...779c46daaac9f.jpg | image | 123.4 KB | 123.0 KB |
| https://www.antiquit...4e6beeebc0270.jpg | image | 122.4 KB | 122.0 KB |
| https://www.antiquit...0c6e583fe5f03.jpg | image | 110.7 KB | 110.4 KB |
| https://www.antiquit...ns-Semibold.woff2 | plain | 62.5 KB | 62.2 KB |
| https://www.antiquit...nSans-Light.woff2 | plain | 61.8 KB | 61.5 KB |
| https://www.antiquit...ans-Regular.woff2 | plain | 60.6 KB | 60.3 KB |
| https://www.antiquit...iboldItalic.woff2 | plain | 59.6 KB | 59.3 KB |
| https://www.antiquit...ine/18/banner.jpg | image | 58.9 KB | 58.6 KB |
| https://www.antiquit...282e2df98d27e.jpg | image | 53.5 KB | 53.3 KB |
| https://www.antiquit....22.custom.min.js | javascript | 51.1 KB | 202.8 KB |
| Content | Header Size | Transfer Size | Content Size | Requests |
|---|---|---|---|---|
| html | 0 b | 7.4 KB | 29.1 KB | 1 |
| css | 0 b | 28.1 KB | 167.7 KB | 2 |
| javascript | 0 b | 288.0 KB | 883.5 KB | 7 |
| image | 0 b | 4.0 MB | 4.0 MB | 52 |
| plain | 0 b | 289.9 KB | 288.0 KB | 7 |
| Total | 0 b | 4.6 MB | 5.3 MB | 69 |
| Domain | Total download time | Transfer Size | Content Size | Requests |
|---|---|---|---|---|
| www.antiquites-en-france.com | 9.940 s | 4.5 MB | 4.9 MB | 69 |
| www.google-analytics.com | 118 ms | 21.4 KB | 51.1 KB | 2 |
| www.googletagmanager.com | 45 ms | 158.3 KB | 465.3 KB | 1 |
| region1.google-analytics.com | 34 ms | N/A | 0 b | 1 |
| type | min | median | max |
|---|---|---|---|
| Expires | 0 seconds | 1 week | 1 week |
| Last modified | 17 hours | 11 years | 28 years |
Included requests done after load event end.
| Content | Transfer Size | Requests |
|---|---|---|
| html | 0 b | 0 |
| css | 0 b | 0 |
| javascript | 0 b | 0 |
| image | 1.5 KB | 1 |
| font | 0 b | 0 |
| Total | 1.5 KB | 1 |
Includes requests done after DOM content loaded.
| Content | Transfer Size | Requests |
|---|---|---|
| html | 0 b | 0 |
| css | 1.9 KB | 1 |
| javascript | 158.3 KB | 1 |
| image | 1.2 MB | 9 |
| font | 0 b | 0 |
| plain | 474 B | 2 |
| Total | 1.3 MB | 13 |
Render blocking information directly from Chrome.
| Blocking | In body parser blocking | Potentially blocking |
|---|---|---|
| 5 | 0 | 0 |
| URL | Type |
|---|---|
| https://www.googleta...nager.com/gtag/js | non_blocking |
| https://www.antiquit...ns-Semibold.woff2 | non_blocking |
| https://www.antiquit...nSans-Light.woff2 | non_blocking |
| https://www.antiquit...ans-Regular.woff2 | non_blocking |
| https://www.antiquit...iboldItalic.woff2 | non_blocking |
| https://www.antiquit....22.custom.min.js | blocking |
| https://www.antiquit...ika-Regular.woff2 | non_blocking |
| https://www.antiquit.../js/jquery.min.js | blocking |
| https://www.antiquit...m/css/all.min.css | blocking |
| https://www.google-a....com/analytics.js | non_blocking |
| https://www.antiquit...eriacustom.min.js | blocking |
| https://www.antiquit...m/js/all-2.min.js | blocking |
| https://www.antiquit...leria.azur.min.js | non_blocking |
| https://www.antiquit...galleria.azur.css | dynamically_injected_non_blocking |
Download the Chrome trace log and drag and drop it into Developer Tools / Performance in Chrome.
Collected using the Long Task API. A long task is a task that take 50 milliseconds or more.
| Type | Quantity | Total duration (ms) |
|---|---|---|
| Total Blocking Time | 108 | |
| Max Potential First Input Delay | 102 | |
| Long Tasks before First Paint | 0 | 0 |
| Long Tasks before First Contentful Paint | 0 | 0 |
| Long Tasks before Largest Contentful Paint | 2 | 172 |
| Long Tasks after Load Event End | 0 | 0 |
| Total Long Tasks | 3 | 258 |
CPU last long task happened at 949 ms
| name | startTime | duration | containerId | containerName | containerSrc | containerType |
|---|---|---|---|---|---|---|
| self | 402 | 102 | window | |||
| self | 521 | 70 | window | |||
| self | 949 | 86 | window |
Calculated using Tracium.
| Categories (ms) | |
|---|---|
| parseHTML | 47 |
| styleLayout | 227 |
| paintCompositeRender | 23 |
| scriptParseCompile | 1 |
| scriptEvaluation | 559 |
| garbageCollection | 17 |
| other | 250 |
| Events (ms) | |
|---|---|
| FunctionCall | 256 |
| RunTask | 214 |
| Layout | 173 |
| v8.run | 169 |
| v8.callFunction | 61 |
| UpdateLayoutTree | 54 |
| ParseHTML | 36 |
| TimerFire | 32 |
| RunMicrotasks | 22 |
| Paint | 16 |
| HTMLDocumentParser::MaybeFetchQueuedPreloads | 14 |
| V8.GC_HEAP_EPILOGUE | 11 |
| PrePaint | 11 |
| URL | CPU time (ms) |
|---|---|
| https://www.antiquites-en-france.com/galleria/themes/azur/galleria.azur.min.js | 515 |
| https://www.antiquites-en-france.com/galleria/galleriacustom.min.js | 374 |
| https://www.antiquites-en-france.com/js/jquery.min.js | 165 |
| https://www.googletagmanager.com/gtag/js?id=G-58XGFJWZ1E&cx=c&_slc=1 | 90 |
| https://www.google-analytics.com/analytics.js | 72 |
| https://www.antiquites-en-france.com/vendor/jquery-ui/js/jquery-ui-1.8.22.custom.min.js | 21 |
| Tool/domain | Time (ms) |
|---|---|
| www.antiquites-en-france.com | 1074.2 |
| Google Tag Manager | 89.9 |
| Google Analytics | 72.3 |
Third party requests categorised by Third party web version 0.26.2.
| Category | Requests |
|---|---|
| analytics | 3 |
| survelliance | 4 |
| tag-manager | 1 |
| Category | Number of tools |
|---|---|
| analytics | 1 |
| survelliance | 2 |
| tag-manager | 1 |
| analytics (3 requests) |
| Google Analytics |
|
| survelliance (4 requests) |
| Google Analytics |
| Google Tag Manager |
|
| tag-manager (1 requests) |
| Google Tag Manager |
|
Calculated using .*antiquites-en-france.* (use --firstParty to configure).
| Content | Header Size | Transfer Size | Content Size | Requests |
|---|---|---|---|---|
| html | 0 b | 7.4 KB | 29.1 KB | 1 |
| css | 0 b | 28.1 KB | 167.7 KB | 2 |
| javascript | 0 b | 108.8 KB | 367.1 KB | 5 |
| image | 0 b | 4.0 MB | 4.0 MB | 52 |
| font | 0 b | 0 b | 0 b | 0 |
| plain | 0 b | 289.5 KB | 288.0 KB | 5 |
| Total | N/A | 4.5 MB | 4.9 MB | 69 |
| Content | Header Size | Transfer Size | Content Size | Requests |
|---|---|---|---|---|
| html | 0 b | 0 b | 0 b | 0 |
| css | 0 b | 0 b | 0 b | 0 |
| javascript | 0 b | 179.2 KB | 516.4 KB | 2 |
| image | 0 b | 0 b | 0 b | 0 |
| font | 0 b | 0 b | 0 b | 0 |
| plain | 0 b | 474 B | 15 B | 2 |
| Total | N/A | 179.6 KB | 516.4 KB | 4 |
Axe is an accessibility testing engine for websites and other HTML-based user interfaces. Tested using axe-core version 4.10.2. Read more about axe-core .
Median number of violations for all the runs. Check each individual run to see all the violations.
| Type | Violations (median) |
|---|---|
| Critical | 1 (6 issues) |
| Serious | 3 (8 issues) |
| Moderate | 2 (26 issues) |
| Minor | 0 (0 issues) |