Tested 2025-12-09 02:39:41 using Chrome 132.0.6834.83 (runtime settings).
| Metric | Value |
|---|---|
| Page metrics | |
| Performance Score | 90 |
| Total Page Transfer Size | 93.4 KB |
| Requests | 6 |
| Timing metrics | |
| TTFB [median] | 117 ms |
| First Paint [median] | 237 ms |
| Fully Loaded [median] | 743 ms |
| Google Web Vitals | |
| TTFB [median] | 117 ms |
| First Contentful Paint (FCP) [median] | 237 ms |
| Largest Contentful Paint (LCP) [median] | 416 ms |
| Cumulative Layout Shift (CLS) [median] | 0.00 |
| Interaction To Next Paint (INP) [median] | 240 ms |
| Total Blocking Time [median] | 53 ms |
| Max Potential FID [median] | 99 ms |
| CPU metrics | |
| CPU long tasks [median] | 2 |
| CPU longest task duration | 157 ms |
| CPU last long task happens at | 571 ms |
| Visual Metrics | |
| First Visual Change [median] | 266 ms |
| Speed Index [median] | 433 ms |
| Visual Complete 85% [median] | 433 ms |
| Visual Complete 99% [median] | 466 ms |
| Last Visual Change [median] | 466 ms |

| Metric | min | median | mean | max |
|---|---|---|---|---|
| Visual Metrics | ||||
| FirstVisualChange | 100 ms | 266 ms | 266 ms | 433 ms |
| LastVisualChange | 133 ms | 466 ms | 388 ms | 566 ms |
| SpeedIndex | 104 ms | 433 ms | 329 ms | 449 ms |
| LargestImage | 133 ms | 350 ms | 566 ms | |
| LargestContentfulPaint | 133 ms | 433 ms | 377 ms | 566 ms |
| LastMeaningfulPaint | 133 ms | 433 ms | 377 ms | 566 ms |
| VisualReadiness | 33 ms | 33 ms | 122 ms | 300 ms |
| VisualComplete85 | 100 ms | 433 ms | 366 ms | 566 ms |
| VisualComplete95 | 133 ms | 433 ms | 377 ms | 566 ms |
| VisualComplete99 | 133 ms | 466 ms | 388 ms | 566 ms |
| Heading | 433 ms | 500 ms | 566 ms | |
| Google Web Vitals | ||||
| Time To First Byte (TTFB) | 51 ms | 117 ms | 102 ms | 139 ms |
| Largest Contentful Paint (LCP) | 110 ms | 416 ms | 354 ms | 535 ms |
| First Contentful Paint (FCP) | 88 ms | 237 ms | 247 ms | 416 ms |
| Cumulative Layout Shift (CLS) | 0 | 0.0031 | 0.0093 | 0.0248 |
| More metrics | ||||
| firstPaint | 88 ms | 237 ms | 247 ms | 416 ms |
| loadEventEnd | 96 ms | 549 ms | 448 ms | 698 ms |
| CPU | ||||
| Total Blocking Time | 0 ms | 53 ms | 62 ms | 132 ms |
| Max Potential FID | 0 ms | 99 ms | 67 ms | 103 ms |
| CPU long tasks | 0 | 2 | 2 | 3 |
| CPU last long task happens at | 0 ms | 571 ms | 396 ms | 616 ms |
Run 2 SpeedIndex median
Use--filmstrip.showAll to show all filmstrips.
 0 s0.3 sCPU Long Task duration 157 ms
 0.5 sFirst Contentful Paint 416 msLCP <H1> 416 msFirst Visual Change 433 msVisual Complete 85% 433 msVisual Complete 95% 433 msHeading 433 msDOM Content Loaded Time 444 msLast Visual Change 466 msVisual Complete 99% 466 ms
The coach helps you find performance problems on your web page using web performance best practice rules. And gives you advice on privacy and best practices. Tested using Coach-core version 8.1.1.

| Title | Advice | Score | ||||||
|---|---|---|---|---|---|---|---|---|
| Have a fast largest contentful paint (largestContentfulPaint) | You can add fetchPriority="high" to the image to increase the load priority in Chrome. | 95 | ||||||
| Description: Largest contentful paint is one of Google Web Vitals and reports the render time of the largest image or text block visible within the viewport, relative to when the page first started loading. To be fast according to Google, it needs to render before 2.5 seconds and results over 4 seconds is poor performance. | ||||||||
| Avoid extra requests by setting cache headers (cacheHeaders) | The page has 5 requests that are missing a cache time. Configure a cache time so the browser doesn't need to download them every time. It will save 90.1 kB the next access. | 50 | ||||||
| Description: The easiest way to make your page fast is to avoid doing requests to the server. Setting a cache header on your server response will tell the browser that it doesn't need to download the asset again during the configured cache time! Always try to set a cache time if the content doesn't change for every request. | ||||||||
| Offenders: | ||||||||
| Always compress text content (compressAssets) | The page has 1 request that are served uncompressed. You could save a lot of bytes by sending them compressed instead. | 90 | ||||||
| Description: In the early days of the Internet there were browsers that didn't support compressing (gzipping) text content. They do now. Make sure you compress HTML, JSON, JavaScript, CSS and SVG. It will save bytes for the user; making the page load faster and use less bandwith. | ||||||||
Offenders:
| ||||||||
| The favicon should be small and cacheable (favicon) | The favicon size is 12 kB bytes. That's quite big, can you make it smaller? The favicon has no cache time. | 0 | ||||||
| Description: It is easy to make the favicon big but please avoid doing that, because every browser will then perform an unnecessarily large download. And make sure the cache headers are set for a long time for the favicon. It is easy to miss since it's another content type. | ||||||||
| Offenders: | ||||||||
| Avoid too many fonts (fewFonts) | The page has 2 font requests. Do you really need them? What value does the fonts give the user? | 80 | ||||||
| Description: How many fonts do you need on a page for the user to get the message? Fonts can slow down the rendering of content, try to avoid loading too many of them because worst case it can make the text invisible until they are loaded (FOIT—flash of invisible text), best case they will flicker the text content when they arrive. | ||||||||
| Offenders: | ||||||||
| Avoid missing and error requests (responseOk) | The page has 1 error response. The page has 1 response with code 404. | 90 | ||||||
| Description: Your page should never request assets that return a 400 or 500 error. These requests are never cached. If that happens something is broken. Please fix it. | ||||||||
| Offenders: | ||||||||
| Title | Advice | Score |
|---|---|---|
| Use a good Content-Security-Policy header to make sure you you avoid Cross Site Scripting (XSS) attacks. (contentSecurityPolicyHeader) | Set a Content-Security-Policy header to make sure you are not open for Cross Site Scripting (XSS) attacks. You can start with setting a Content-Security-Policy-Report-Only header, that will only report the violation, not stop the download. | 0 |
| Description: Content Security Policy is delivered via a HTTP response header, and defines approved sources of content that the browser may load. It can be an effective countermeasure to Cross Site Scripting (XSS) attacks and is also widely supported and usually easily deployed. https://scotthelme.co.uk/content-security-policy-an-introduction/. | ||
| Offenders: | ||
| Set a referrer-policy header to make sure you do not leak user information. (referrerPolicyHeader) | Set a referrer-policy header to make sure you do not leak user information. | 0 |
| Description: Referrer Policy is a new header that allows a site to control how much information the browser includes with navigations away from a document and should be set by all sites. https://scotthelme.co.uk/a-new-security-header-referrer-policy/. | ||
| Offenders: | ||
| Page info | |
|---|---|
| Title | Site not installed |
| Width | 1350 |
| Height | 886 |
| DOM elements | 48 |
| Avg DOM depth | 5 |
| Max DOM depth | 8 |
| Iframes | 0 |
| Script tags | 0 |
| Local storage | 0 b |
| Session storage | 0 b |
| Network Information API | 4g |
Data collected using Wappalyzer version 6.10.66. With updated code from Webappanalyzer 2024-12-27. Use --browsertime.firefox.includeResponseBodies htmlor --browsertime.chrome.includeResponseBodies htmlto help Wappalyzer find more information about technologies used.
Wappalyzer didn't find any information.
Data from run 2
| Visual Metrics | |
|---|---|
| First Visual Change | 433 ms |
| Speed Index | 433 ms |
| Heading | 433 ms |
| LargestContentfulPaint | 433 ms |
| Last Meaningful Paint | 433 ms |
| Largest Contentful Paint | 433 ms |
| Visual Complete 85% | 433 ms |
| Visual Complete 95% | 433 ms |
| Visual Complete 99% | 466 ms |
| Last Visual Change | 466 ms |
| Visual Readiness | 33 ms |
| Navigation Timing | |
|---|---|
| backEndTime | 117 ms |
| domContentLoadedTime | 444 ms |
| domInteractiveTime | 444 ms |
| domainLookupTime | 0 ms |
| frontEndTime | 579 ms |
| pageDownloadTime | 1 ms |
| pageLoadTime | 698 ms |
| redirectionTime | 0 ms |
| serverConnectionTime | 15 ms |
| serverResponseTime | 97 ms |
| Google Web Vitals | |
|---|---|
| Time to first byte (TTFB) | 117 ms |
| First Contentful Paint (FCP) | 416 ms |
| Largest Contentful Paint (LCP) | 416 ms |
| Interaction to next paint (INP) | 192 ms |
| Total Blocking Time (TBT) | 53 ms |
| First Contentful Paint info | |
|---|---|
| Elements that needed recalculate style before FCP | 273 |
| Time spent in recalculate style before FCP | 18.821 ms |
| Extra timings | |
|---|---|
| TTFB | 117 ms |
| First Paint | 416 ms |
| Load Event End | 698 ms |
| Fully loaded | 768 ms |
When in time the page main content is rendered (collected using the Largest Contentful Paint API). Read more about Largest Contentful Paint.
| Element type | H1 |
| Element/tag | <h1></h1> |
| Render time | 416 ms |
| Element render delay | 298 ms |
| TTFB | 117 ms |
| Resource delay | 0 ms |
| Resource load duration | 0 ms |
| Elements that needed recalculate style before LCP | 273 |
| Time spent in recalculate style before LCP | 18.821 ms |
| Load time | 0 ms |
| Size (width*height) | 11988 |
| DOM path | |
| div:eq(3) > div:eq(0) > div > div > div > div > h1> div:eq(3) > div:eq(0) > div > div > div > div > h1> | |
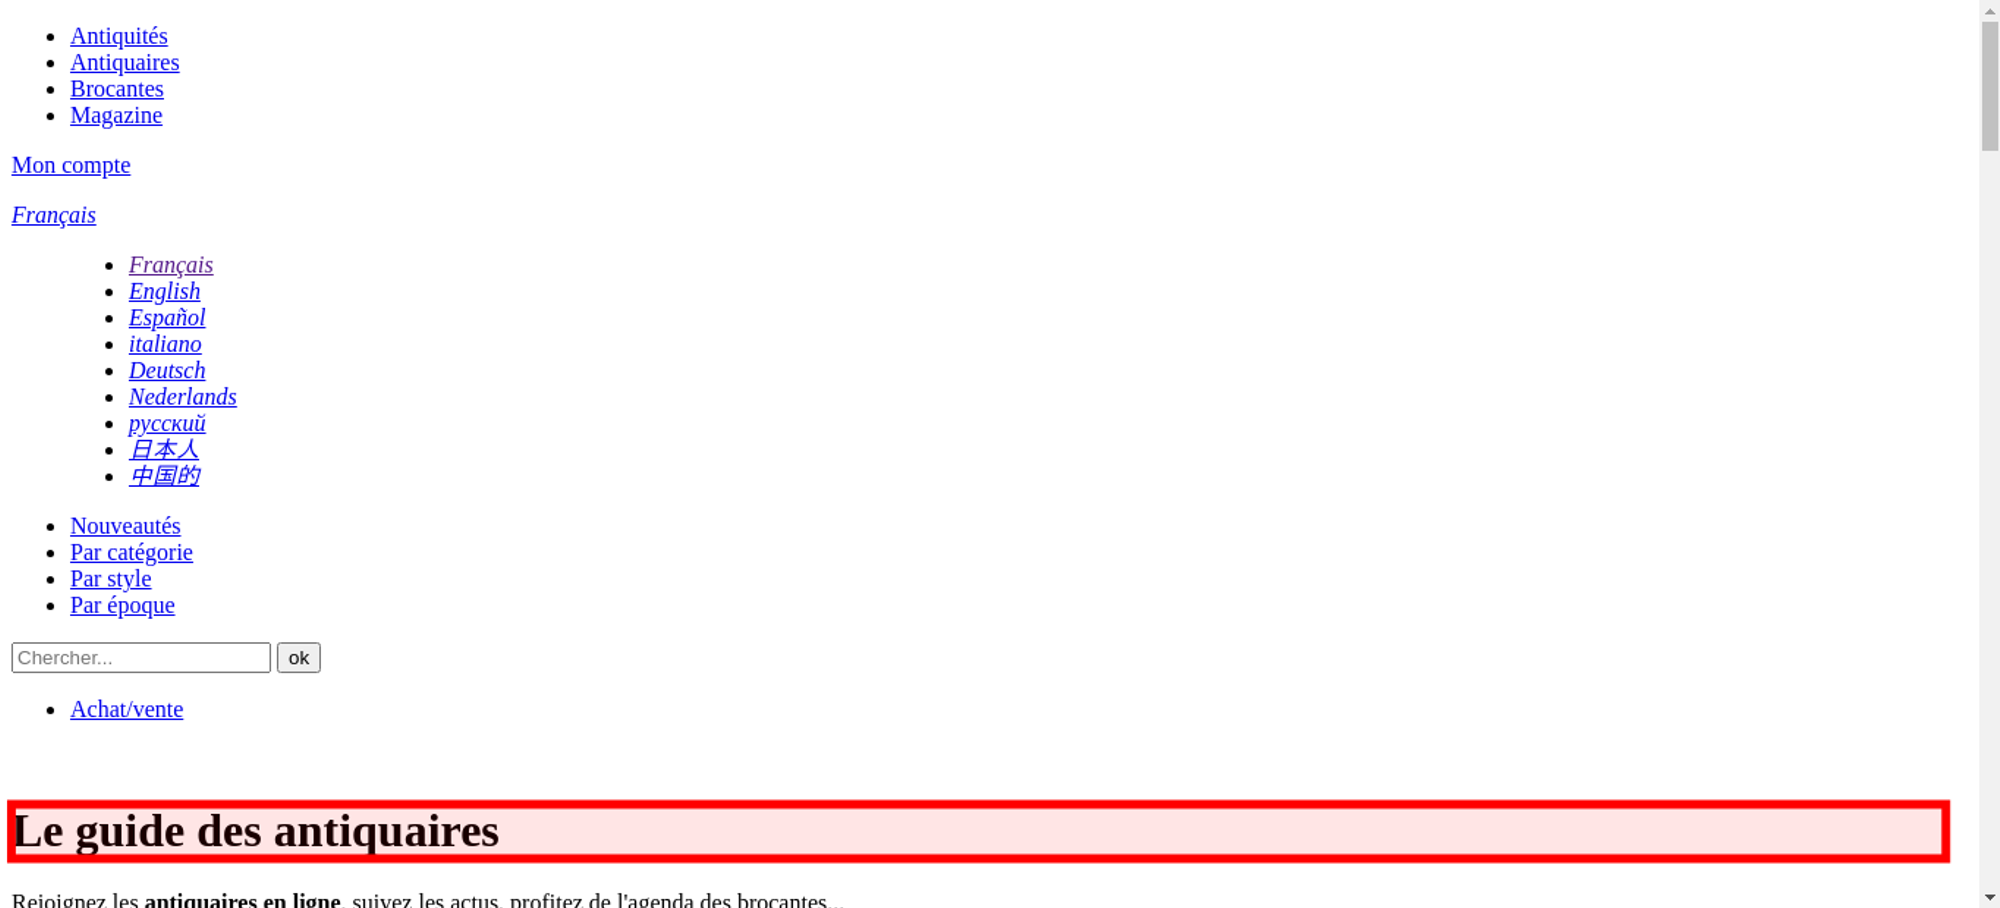
The largest contentful paint is highlighted in the image. If no element is highlighted the element was removed before the screenshot or the LCP API couldn't find the element.
No layout shift detected.
Interaction to Next Paint (INP) is a metric that try to measure responsiveness. It's useful if you are testing user journeys. Read more about Interaction to Next Paint.
The measured latency was 192 ms.
| Event type | pointerover |
| Element type | HTML |
| Element class name | |
| Event target | html |
| Load state when the event happened | loading |
Read more about the Long Animation Frames API here here.
The top 10 longest animation frames entries
| Blocking duration | Work duration | Render duration | PreLayout Duration | Style And Layout Duration |
|---|---|---|---|---|
| 116 ms | 10.7 ms | 156.3 ms | 153.2 ms | 3.1 ms |
| No availible script information. | ||||
| Blocking duration | Work duration | Render duration | PreLayout Duration | Style And Layout Duration |
|---|---|---|---|---|
| 53 ms | 103 ms | 0 ms | 0 ms | 0 ms |
| https://www.googletagmanager.com/gtag/js?id=G-58XGFJWZ1E&cx=c&_slc=1 | ||||
Invoker: https://www.googletagmanager.com/gtag/js?id=G-58XGFJWZ1E&cx=c&_slc=1 | ||||
| Blocking duration | Work duration | Render duration | PreLayout Duration | Style And Layout Duration |
|---|---|---|---|---|
| 0 ms | 105.1 ms | -0.1 ms | 0.5 ms | -0.6 ms |
| https://www.antiquites-en-france.com/js/jquery.min.js | ||||
Invoker: https://www.antiquites-en-france.com/js/jquery.min.js | ||||
| https://www.antiquites-en-france.com/vendor/jquery-ui/js/jquery-ui-1.8.22.custom.min.js | ||||
Invoker: https://www.antiquites-en-france.com/vendor/jquery-ui/js/jquery-ui-1.8.22.custom.min.js | ||||
There are no Server Timings.
There are no custom configured scripts.
There are no custom extra metrics from scripting.
| Name | Display Time | X | Y | Width | Height |
|---|---|---|---|---|---|
| Heading | 433 ms | 8 | 548 | 1334 | 37 |
| <h1></h1> | |||||
| LargestContentfulPaint | 433 ms | 8 | 548 | 1334 | 37 |
| <h1></h1> | |||||
How the page is built.
| Summary | |
|---|---|
| HTTP version | HTTP/2.0 |
| Total requests | 6 |
| Total domains | 1 |
| Total transfer size | 93.4 KB |
| Total content size | 92.0 KB |
| Responses missing compression | 1 |
| Number of cookies | 0 |
| Third party cookies | 0 |
| Requests per response code | |
|---|---|
| 200 | 5 |
| 404 | 1 |
| URL | Type | Transfer Size | Content Size |
|---|---|---|---|
| https://www.antiquit...ular-webfont.woff | font | 31.3 KB | 31.1 KB |
| https://www.antiquit...ight-webfont.woff | font | 30.6 KB | 30.3 KB |
| https://www.antiquit...img/misconfig.png | image | 12.4 KB | 12.2 KB |
| https://www.antiquit...n/img/favicon.ico | favicon | 11.7 KB | 11.4 KB |
| https://www.antiquites-en-france.com/ | html | 5.4 KB | 5.3 KB |
| https://www.antiquit...img/icon-book.png | image | 2.0 KB | 1.8 KB |
| Content | Header Size | Transfer Size | Content Size | Requests |
|---|---|---|---|---|
| image | 0 b | 14.4 KB | 13.9 KB | 2 |
| font | 0 b | 61.9 KB | 61.4 KB | 2 |
| favicon | 0 b | 11.7 KB | 11.4 KB | 1 |
| Total | 0 b | 87.9 KB | 86.7 KB | 5 |
| Domain | Total download time | Transfer Size | Content Size | Requests |
|---|---|---|---|---|
| www.antiquites-en-france.com | 101 ms | 93.4 KB | 92.0 KB | 6 |
| type | min | median | max |
|---|---|---|---|
| Expires | 0 seconds | 0 seconds | 0 seconds |
| Last modified | 13 weeks | 13 weeks | 13 weeks |
Included requests done after load event end.
| Content | Transfer Size | Requests |
|---|---|---|
| html | 0 b | 0 |
| css | 0 b | 0 |
| javascript | 0 b | 0 |
| image | 0 b | 0 |
| font | 0 b | 0 |
| favicon | 11.7 KB | 1 |
| Total | 11.7 KB | 1 |
Includes requests done after DOM content loaded.
| Content | Transfer Size | Requests |
|---|---|---|
| html | 0 b | 0 |
| css | 0 b | 0 |
| javascript | 0 b | 0 |
| image | 0 b | 0 |
| font | 61.9 KB | 2 |
| favicon | 11.7 KB | 1 |
| Total | 73.6 KB | 3 |
Render blocking information directly from Chrome.
| Blocking | In body parser blocking | Potentially blocking |
|---|---|---|
| 0 | 0 | 0 |
| URL | Type |
|---|---|
| https://www.antiquit...ular-webfont.woff | non_blocking |
| https://www.antiquit...ight-webfont.woff | non_blocking |
Download the Chrome trace log and drag and drop it into Developer Tools / Performance in Chrome.
Collected using the Long Task API. A long task is a task that take 50 milliseconds or more.
| Type | Quantity | Total duration (ms) |
|---|---|---|
| Total Blocking Time | 53 | |
| Max Potential First Input Delay | 103 | |
| Long Tasks before First Paint | 1 | 157 |
| Long Tasks before First Contentful Paint | 1 | 157 |
| Long Tasks before Largest Contentful Paint | 1 | 157 |
| Long Tasks after Load Event End | 0 | 0 |
| Total Long Tasks | 2 | 260 |
CPU last long task happened at 571 ms
| name | startTime | duration | containerId | containerName | containerSrc | containerType |
|---|---|---|---|---|---|---|
| unknown | 240 | 157 | window | |||
| self | 571 | 103 | window |
Calculated using Tracium.
| Categories (ms) | |
|---|---|
| parseHTML | 30 |
| styleLayout | 172 |
| paintCompositeRender | 9 |
| scriptParseCompile | 1 |
| scriptEvaluation | 170 |
| garbageCollection | 12 |
| other | 178 |
| Events (ms) | |
|---|---|
| Layout | 146 |
| v8.run | 122 |
| RunTask | 119 |
| URLLoader::Context::OnReceivedResponse | 44 |
| UpdateLayoutTree | 25 |
| ParseHTML | 23 |
| RunMicrotasks | 19 |
| FunctionCall | 13 |
| HTMLDocumentParser::MaybeFetchQueuedPreloads | 12 |
| Tool/domain | Time (ms) |
|---|---|
| Google Tag Manager | 106.9 |
| www.antiquites-en-france.com | 45.8 |
| Google Analytics | 20.1 |
Third party requests categorised by Third party web version 0.26.2.
| Category | Requests |
|---|---|
| analytics | 3 |
| survelliance | 4 |
| tag-manager | 1 |
| Category | Number of tools |
|---|---|
| analytics | 1 |
| survelliance | 2 |
| tag-manager | 1 |
| analytics (3 requests) |
| Google Analytics |
|
| survelliance (4 requests) |
| Google Analytics |
| Google Tag Manager |
|
| tag-manager (1 requests) |
| Google Tag Manager |
|
Calculated using .*antiquites-en-france.* (use --firstParty to configure).
| Content | Header Size | Transfer Size | Content Size | Requests |
|---|---|---|---|---|
| html | 0 b | 0 b | 0 b | 0 |
| css | 0 b | 0 b | 0 b | 0 |
| javascript | 0 b | 0 b | 0 b | 0 |
| image | 0 b | 14.4 KB | 13.9 KB | 2 |
| font | 0 b | 61.9 KB | 61.4 KB | 2 |
| favicon | 0 b | 11.7 KB | 11.4 KB | 1 |
| Total | N/A | 93.4 KB | 92.0 KB | 6 |
| Content | Header Size | Transfer Size | Content Size | Requests |
|---|---|---|---|---|
| html | 0 b | 0 b | 0 b | 0 |
| css | 0 b | 0 b | 0 b | 0 |
| javascript | 0 b | 0 b | 0 b | 0 |
| image | 0 b | 0 b | 0 b | 0 |
| font | 0 b | 0 b | 0 b | 0 |
| Total | N/A | N/A | N/A |
Axe is an accessibility testing engine for websites and other HTML-based user interfaces. Tested using axe-core version 4.10.2. Read more about axe-core .
Median number of violations for all the runs. Check each individual run to see all the violations.
| Type | Violations (median) |
|---|---|
| Critical | 0 (0 issues) |
| Serious | 2 (6 issues) |
| Moderate | 2 (20 issues) |
| Minor | 0 (0 issues) |