Tested 2025-04-14 01:40:38 using Chrome 132.0.6834.83 (runtime settings).
| Metric | Value |
|---|---|
| Page metrics | |
| Performance Score | 87 |
| Total Page Transfer Size | 574.8 KB |
| Requests | 23 |
| Timing metrics | |
| TTFB [median] | 34 ms |
| First Paint [median] | 160 ms |
| Fully Loaded [median] | 576 ms |
| Google Web Vitals | |
| TTFB [median] | 34 ms |
| First Contentful Paint (FCP) [median] | 160 ms |
| Largest Contentful Paint (LCP) [median] | 160 ms |
| Cumulative Layout Shift (CLS) [median] | 0.04 |
| Interaction To Next Paint (INP) [median] | 128 ms |
| Total Blocking Time [median] | 59 ms |
| Max Potential FID [median] | 85 ms |
| CPU metrics | |
| CPU long tasks [median] | 3 |
| CPU longest task duration | 140 ms |
| CPU last long task happens at | 470 ms |
| Visual Metrics | |
| First Visual Change [median] | 167 ms |
| Speed Index [median] | 185 ms |
| Visual Complete 85% [median] | 200 ms |
| Visual Complete 99% [median] | 233 ms |
| Last Visual Change [median] | 233 ms |

| Metric | min | median | mean | max |
|---|---|---|---|---|
| Visual Metrics | ||||
| FirstVisualChange | 166 ms | 167 ms | 200 ms | 267 ms |
| LastVisualChange | 233 ms | 233 ms | 255 ms | 300 ms |
| SpeedIndex | 174 ms | 185 ms | 211 ms | 274 ms |
| LargestImage | 233 ms | 233 ms | 255 ms | 300 ms |
| Heading | 233 ms | 233 ms | 255 ms | 300 ms |
| LargestContentfulPaint | 233 ms | 233 ms | 255 ms | 300 ms |
| LastMeaningfulPaint | 233 ms | 233 ms | 255 ms | 300 ms |
| VisualReadiness | 33 ms | 66 ms | 55 ms | 67 ms |
| VisualComplete85 | 167 ms | 200 ms | 222 ms | 300 ms |
| VisualComplete95 | 233 ms | 233 ms | 255 ms | 300 ms |
| VisualComplete99 | 233 ms | 233 ms | 255 ms | 300 ms |
| Google Web Vitals | ||||
| Time To First Byte (TTFB) | 33 ms | 34 ms | 37 ms | 44 ms |
| Largest Contentful Paint (LCP) | 143 ms | 160 ms | 187 ms | 257 ms |
| First Contentful Paint (FCP) | 143 ms | 160 ms | 187 ms | 257 ms |
| Cumulative Layout Shift (CLS) | 0.0398 | 0.0398 | 0.0407 | 0.0425 |
| More metrics | ||||
| firstPaint | 143 ms | 160 ms | 187 ms | 257 ms |
| loadEventEnd | 178 ms | 184 ms | 307 ms | 558 ms |
| CPU | ||||
| Total Blocking Time | 55 ms | 59 ms | 93 ms | 165 ms |
| Max Potential FID | 84 ms | 85 ms | 103 ms | 140 ms |
| CPU long tasks | 3 | 3 | 3 | 4 |
| CPU last long task happens at | 419 ms | 470 ms | 465 ms | 505 ms |
Run 2 SpeedIndex median
Use--filmstrip.showAll to show all filmstrips.
 0 s
0 s 0.2 sLayout Shift 0.03895 117 msFirst Contentful Paint 160 msLCP <IMG> 160 msFirst Visual Change 166 msDOM Content Loaded Time 167 msPage Load Time 176 msLayout Shift 0.00086 181 msVisual Complete 85% 200 ms
 0.3 sLast Visual Change 233 msVisual Complete 95% 233 msVisual Complete 99% 233 msLargest Image 233 msHeading 233 msCPU Long Task duration 140 ms
The coach helps you find performance problems on your web page using web performance best practice rules. And gives you advice on privacy and best practices. Tested using Coach-core version 8.1.1.

| Title | Advice | Score | |||||||||||||||||||||
|---|---|---|---|---|---|---|---|---|---|---|---|---|---|---|---|---|---|---|---|---|---|---|---|
| Avoid slowing down the critical rendering path (avoidRenderBlocking) | The page has 1 blocking requests and 1 in body parser blocking (1 JavaScript and 1 CSS). There are 1 potentially render blocking requests. You need to verify if it is render blocking: https://www.googletagmanager.com/gtag/js?id=UA-96091873-1 | 89 | |||||||||||||||||||||
| Description: The critical rendering path is what the browser needs to do to start rendering the page. Every file requested inside of the head element will postpone the rendering of the page, because the browser need to do the request. Avoid loading JavaScript synchronously inside of the head (you should not need JavaScript to render the page), request files from the same domain as the main document (to avoid DNS lookups) and inline CSS for really fast rendering and a short rendering path. | |||||||||||||||||||||||
| Offenders: | |||||||||||||||||||||||
| Avoid using Google Tag Manager. (googleTagManager) | The page is using Google Tag Manager, this is a performance risk since non-tech users can add JavaScript to your page. | 0 | |||||||||||||||||||||
| Description: Google Tag Manager makes it possible for non tech users to add scripts to your page that will downgrade performance. | |||||||||||||||||||||||
| Inline CSS for faster first render (inlineCss) | The page has both inline CSS and CSS requests even though it uses a HTTP/2-ish connection. If you have many users on slow connections, it can be better to only inline the CSS. Run your own tests and check the waterfall graph to see what happens. | 95 | |||||||||||||||||||||
| Description: In the early days of the Internet, inlining CSS was one of the ugliest things you can do. That has changed if you want your page to start rendering fast for your user. Always inline the critical CSS when you use HTTP/1 and HTTP/2 (avoid doing CSS requests that block rendering) and lazy load and cache the rest of the CSS. It is a little more complicated when using HTTP/2. Does your server support HTTP push? Then maybe that can help. Do you have a lot of users on a slow connection and are serving large chunks of HTML? Then it could be better to use the inline technique, becasue some servers always prioritize HTML content over CSS so the user needs to download the HTML first, before the CSS is downloaded. | |||||||||||||||||||||||
| Have a fast largest contentful paint (largestContentfulPaint) | You can add fetchPriority="high" to the image to increase the load priority in Chrome. | 95 | |||||||||||||||||||||
| Description: Largest contentful paint is one of Google Web Vitals and reports the render time of the largest image or text block visible within the viewport, relative to when the page first started loading. To be fast according to Google, it needs to render before 2.5 seconds and results over 4 seconds is poor performance. | |||||||||||||||||||||||
| Avoid CPU Long Tasks (longTasks) | The page has 4 CPU long tasks with the total of 275 ms. The total blocking time is 59 ms and 1 long task before first contentful paint with total time of 66 ms. However the CPU Long Task is depending on the computer/phones actual CPU speed, so you should measure this on the same type of the device that your user is using. Use Geckoprofiler for Firefox or Chromes tracelog to debug your long tasks. | 20 | |||||||||||||||||||||
| Description: Long CPU tasks locks the thread. To the user this is commonly visible as a "locked up" page where the browser is unable to respond to user input; this is a major source of bad user experience on the web today. However the CPU Long Task is depending on the computer/phones actual CPU speed, so you should measure this on the same type of the device that your user is using. To debug you should use the Chrome timeline log and drag/drop it into devtools or use Firefox Geckoprofiler. | |||||||||||||||||||||||
| Offenders: | |||||||||||||||||||||||
| Long cache headers is good (cacheHeadersLong) | The page has 14 requests that have a shorter cache time than 30 days (but still a cache time). | 86 | |||||||||||||||||||||
| Description: Setting a cache header is good. Setting a long cache header (at least 30 days) is even better beacause then it will stay long in the browser cache. But what do you do if that asset change? Rename it and the browser will pick up the new version. | |||||||||||||||||||||||
| Offenders: | |||||||||||||||||||||||
| Avoid too many fonts (fewFonts) | The page has 4 font requests. Do you really need them? What value does the fonts give the user? | 60 | |||||||||||||||||||||
| Description: How many fonts do you need on a page for the user to get the message? Fonts can slow down the rendering of content, try to avoid loading too many of them because worst case it can make the text invisible until they are loaded (FOIT—flash of invisible text), best case they will flicker the text content when they arrive. | |||||||||||||||||||||||
| Offenders: | |||||||||||||||||||||||
| Total JavaScript size shouldn't be too big (javascriptSize) | The total JavaScript transfer size is 442.4 kB and the uncompressed size is 1.3 MB. This is totally crazy! There is really room for improvement here. | 0 | |||||||||||||||||||||
| Description: A lot of JavaScript often means you are downloading more than you need. How complex is the page and what can the user do on the page? Do you use multiple JavaScript frameworks? | |||||||||||||||||||||||
Offenders:
| |||||||||||||||||||||||
| Don't use private headers on static content (privateAssets) | The page has 5 requests with private headers. Make sure that the assets really should be private and only used by one user. Otherwise, make it cacheable for everyone. | 50 | |||||||||||||||||||||
| Description: If you set private headers on content, that means that the content are specific for that user. Static content should be able to be cached and used by everyone. Avoid setting the cache header to private. | |||||||||||||||||||||||
| Offenders: | |||||||||||||||||||||||
| Avoid missing and error requests (responseOk) | The page has 1 error response. The page has 1 response with code 404. | 90 | |||||||||||||||||||||
| Description: Your page should never request assets that return a 400 or 500 error. These requests are never cached. If that happens something is broken. Please fix it. | |||||||||||||||||||||||
| Offenders: | |||||||||||||||||||||||
| Title | Advice | Score |
|---|---|---|
| Avoid using Google Analytics (ga) | The page is using Google Analytics meaning you share your users private information with Google. You should use analytics that care about user privacy, something like https://matomo.org. | 0 |
| Description: Google Analytics share private user information with Google that your user hasn't agreed on sharing. | ||
| Use a good Content-Security-Policy header to make sure you you avoid Cross Site Scripting (XSS) attacks. (contentSecurityPolicyHeader) | Set a Content-Security-Policy header to make sure you are not open for Cross Site Scripting (XSS) attacks. You can start with setting a Content-Security-Policy-Report-Only header, that will only report the violation, not stop the download. | 0 |
| Description: Content Security Policy is delivered via a HTTP response header, and defines approved sources of content that the browser may load. It can be an effective countermeasure to Cross Site Scripting (XSS) attacks and is also widely supported and usually easily deployed. https://scotthelme.co.uk/content-security-policy-an-introduction/. | ||
| Offenders: | ||
| Set a referrer-policy header to make sure you do not leak user information. (referrerPolicyHeader) | Set a referrer-policy header to make sure you do not leak user information. | 0 |
| Description: Referrer Policy is a new header that allows a site to control how much information the browser includes with navigations away from a document and should be set by all sites. https://scotthelme.co.uk/a-new-security-header-referrer-policy/. | ||
| Offenders: | ||
| Do not share user data with third parties. (thirdPartyPrivacy) | The page has 35% requests that are 3rd party (8 requests with a size of 439.4 kB). The page also have request to companies that harvest data from users and do not respect users privacy (see https://en.wikipedia.org/wiki/Surveillance_capitalism). The page do 4 tag-manager requests and uses 1 tag-manager tool. The page do 8 survelliance requests and uses 2 survelliance tools. The page do 4 analytics requests and uses 1 analytics tool. | 0 |
| Description: Using third party requests shares user information with that third party. Please avoid that! The project https://github.com/patrickhulce/third-party-web is used to categorize first/third party requests. | ||
| Offenders: | ||
| Page info | |
|---|---|
| Title | Erreur 404 : document non trouvé |
| Width | 1350 |
| Height | 1211 |
| DOM elements | 184 |
| Avg DOM depth | 6 |
| Max DOM depth | 8 |
| Iframes | 0 |
| Script tags | 8 |
| Local storage | 0 b |
| Session storage | 0 b |
| Network Information API | 4g |
Data collected using Wappalyzer version 6.10.66. With updated code from Webappanalyzer 2024-12-27. Use --browsertime.firefox.includeResponseBodies htmlor --browsertime.chrome.includeResponseBodies htmlto help Wappalyzer find more information about technologies used.
| Technology | Confidence | Category |
|---|---|---|
| PHP 7.2 | 100 | Programming languages |
| HSTS | 100 | Security |
| HTTP/3 | 100 | Miscellaneous |
Data collected using Third Party Web 0.26.2
| Tag-manager |
|---|
| Google Tag Manager |
| Survelliance |
| Google Tag Manager |
| Google Analytics |
| Analytics |
| Google Analytics |
Data from run 2
| Visual Metrics | |
|---|---|
| First Visual Change | 166 ms |
| Speed Index | 185 ms |
| Largest Image | 233 ms |
| Heading | 233 ms |
| LargestContentfulPaint | 233 ms |
| Last Meaningful Paint | 233 ms |
| Largest Contentful Paint | 233 ms |
| Visual Complete 85% | 200 ms |
| Visual Complete 95% | 233 ms |
| Visual Complete 99% | 233 ms |
| Last Visual Change | 233 ms |
| Visual Readiness | 67 ms |
| Navigation Timing | |
|---|---|
| backEndTime | 33 ms |
| domContentLoadedTime | 167 ms |
| domInteractiveTime | 167 ms |
| domainLookupTime | 0 ms |
| frontEndTime | 142 ms |
| pageDownloadTime | 1 ms |
| pageLoadTime | 176 ms |
| redirectionTime | 0 ms |
| serverConnectionTime | 14 ms |
| serverResponseTime | 15 ms |
| Google Web Vitals | |
|---|---|
| Time to first byte (TTFB) | 33 ms |
| First Contentful Paint (FCP) | 160 ms |
| Largest Contentful Paint (LCP) | 160 ms |
| Cumulative Layout Shift (CLS) | 0.04 |
| Total Blocking Time (TBT) | 165 ms |
| First Contentful Paint info | |
|---|---|
| Elements that needed recalculate style before FCP | 218 |
| Time spent in recalculate style before FCP | 6.839 ms |
| Extra timings | |
|---|---|
| TTFB | 33 ms |
| First Paint | 160 ms |
| Load Event End | 178 ms |
| Fully loaded | 616 ms |
When in time the page main content is rendered (collected using the Largest Contentful Paint API). Read more about Largest Contentful Paint.
| Element type | IMG |
| Element/tag | <img src="/img/acc/objet-art-29.jpg" width="230" alt="Objet d'art"> |
| Render time | 160 ms |
| Element render delay | 98 ms |
| TTFB | 33 ms |
| Resource delay | 10 ms |
| Resource load duration | 19 ms |
| Elements that needed recalculate style before LCP | 218 |
| Time spent in recalculate style before LCP | 6.839 ms |
| Load time | 78 ms |
| URL | https://www.anticsto.../objet-art-29.jpg |
| Size (width*height) | 51076 |
| DOM path | |
| div#page > div:eq(1) > a > img> div#page > div:eq(1) > a > img> | |

The largest contentful paint is highlighted in the image. If no element is highlighted the element was removed before the screenshot or the LCP API couldn't find the element.
The Largest Contentful Paint API highlighted this image as a part of the LCP.
0.03981 cumulative layout shift collected from the Cumulative Layout Shift API.
These HTML elements contribute most to the Cumulative Layout Shifts of the page. The higher score, the more layout shift.
| Score | HTML Element |
|---|---|
| 0.03895 | <div class="vig-cat"></div>,<h2 class="titre"></h2>,<div class="vig-cat"></div>,<h2 class="titre"></h2>,<div class="vig-cat"></div> |
| body > div#page > div:eq(3),body > div#page > div:eq(3) > a > h2,body > div#page > div:eq(4),body > div#page > div:eq(4) > a > h2,body > div#page > div:eq(5) | |
| 0.00086 | <div class="droite"></div>,<li></li>,<li></li> |
| body > header > div,body > header > nav > ul#menu > li:eq(1),body > header > nav > ul#menu > li:eq(2) | |
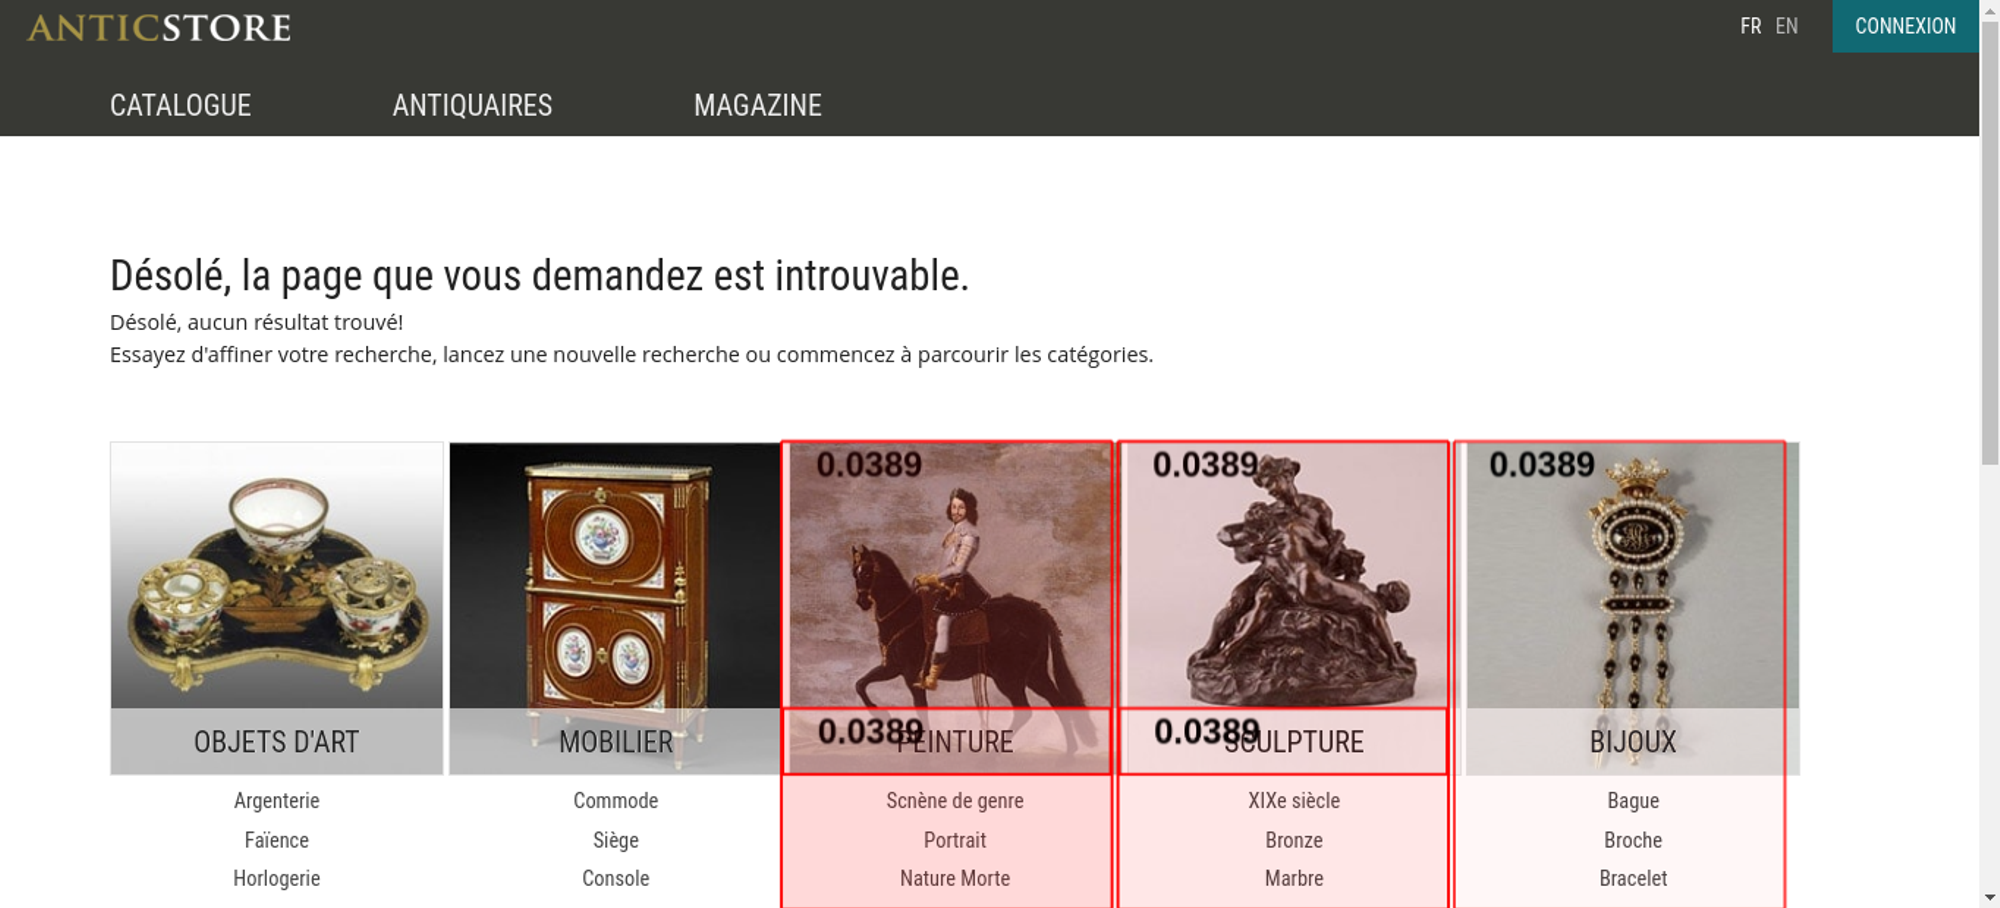
The elements that have shifted place is highlighted in the image (that have a higher value than 0.01). If the element shifted outside of the viewport, you will not see it there. It can be hard to understand what content that has shifted, if that's the case, checkout the video or the filmstrip of the run.
Read more about the Long Animation Frames API here here.
The top 10 longest animation frames entries
| Blocking duration | Work duration | Render duration | PreLayout Duration | Style And Layout Duration |
|---|---|---|---|---|
| 90 ms | 140 ms | 0 ms | 0 ms | 0 ms |
| https://www.googletagmanager.com/gtag/js?id=UA-17384304-1&l=dataLayer&cx=c>m=457e5490za200&tag_exp=102509682~102803279~102813109~102887800~102926062~103021830~103027016~103050889~103051953~103055465 | ||||
Invoker: https://www.googletagmanager.com/gtag/js?id=UA-17384304-1&l=dataLayer&cx=c>m=457e5490za200&tag_exp=102509682~102803279~102813109~102887800~102926062~103021830~103027016~103050889~103051953~103055465 | ||||
| Blocking duration | Work duration | Render duration | PreLayout Duration | Style And Layout Duration |
|---|---|---|---|---|
| 40 ms | 90 ms | 0 ms | 0 ms | 0 ms |
| https://www.googletagmanager.com/gtag/js?id=G-W9PRST2HXV&l=dataLayer&cx=c>m=457e5490za200&tag_exp=102509682~102803279~102813109~102887800~102926062~103021830~103027016~103050889~103051953~103055465 | ||||
Invoker: https://www.googletagmanager.com/gtag/js?id=G-W9PRST2HXV&l=dataLayer&cx=c>m=457e5490za200&tag_exp=102509682~102803279~102813109~102887800~102926062~103021830~103027016~103050889~103051953~103055465 | ||||
| Blocking duration | Work duration | Render duration | PreLayout Duration | Style And Layout Duration |
|---|---|---|---|---|
| 35 ms | 85 ms | 0 ms | 0 ms | 0 ms |
| https://www.googletagmanager.com/gtag/js?id=G-VQNNWGZM60&l=dataLayer&cx=c>m=457e5490za200&tag_exp=102509683~102803279~102813109~102887800~102926062~103021830~103027016~103050889~103051953~103055465 | ||||
Invoker: https://www.googletagmanager.com/gtag/js?id=G-VQNNWGZM60&l=dataLayer&cx=c>m=457e5490za200&tag_exp=102509683~102803279~102813109~102887800~102926062~103021830~103027016~103050889~103051953~103055465 | ||||
| Blocking duration | Work duration | Render duration | PreLayout Duration | Style And Layout Duration |
|---|---|---|---|---|
| 0 ms | 34.9 ms | 36.1 ms | 0 ms | 36.1 ms |
| No availible script information. | ||||
| Blocking duration | Work duration | Render duration | PreLayout Duration | Style And Layout Duration |
|---|---|---|---|---|
| 0 ms | 62.1 ms | 2.9 ms | 0.6 ms | 2.3 ms |
| https://www.googletagmanager.com/gtag/js?id=UA-96091873-1 | ||||
Invoker: https://www.googletagmanager.com/gtag/js?id=UA-96091873-1 | ||||
There are no Server Timings.
There are no custom configured scripts.
There are no custom extra metrics from scripting.
| Name | Display Time | X | Y | Width | Height |
|---|---|---|---|---|---|
| LargestImage (objet-art-29.jpg) | 233 ms | 76 | 302 | 226 | 226 |
| <img src="/img/acc/objet-art-29.jpg" width="230" alt="Objet d'art"> | |||||
| Heading | 233 ms | 75 | 170 | 1200 | 35 |
| <h1></h1> | |||||
| LargestContentfulPaint (objet-art-29.jpg) | 233 ms | 76 | 302 | 226 | 226 |
| <img src="/img/acc/objet-art-29.jpg" width="230" alt="Objet d'art"> | |||||
How the page is built.
| Summary | |
|---|---|
| HTTP version | HTTP/2.0 |
| Total requests | 23 |
| Total domains | 4 |
| Total transfer size | 574.8 KB |
| Total content size | 1.4 MB |
| Responses missing compression | 8 |
| Number of cookies | 1 |
| Third party cookies | 0 |
| Requests per response code | |
|---|---|
| 200 | 20 |
| 204 | 2 |
| 404 | 1 |
| Content | Header Size | Transfer Size | Content Size | Requests |
|---|---|---|---|---|
| css | 0 b | 8.7 KB | 41.7 KB | 1 |
| javascript | 0 b | 432.0 KB | 1.2 MB | 6 |
| image | 0 b | 67.2 KB | 66.0 KB | 7 |
| font | 0 b | 62.6 KB | 61.2 KB | 4 |
| plain | 0 b | 452 B | 1 B | 3 |
| favicon | 0 b | 631 B | 1.1 KB | 1 |
| Total | 0 b | 571.6 KB | 1.4 MB | 22 |
| Domain | Total download time | Transfer Size | Content Size | Requests |
|---|---|---|---|---|
| www.anticstore.com | 382 ms | 145.7 KB | 197.6 KB | 15 |
| www.googletagmanager.com | 190 ms | 407.6 KB | 1.1 MB | 4 |
| www.google-analytics.com | 49 ms | 21.5 KB | 51.7 KB | 2 |
| region1.google-analytics.com | 136 ms | N/A | 0 b | 2 |
| type | min | median | max |
|---|---|---|---|
| Expires | 0 seconds | 1 week | 1 year |
| Last modified | 2 hours | 8 years | 27 years |
Included requests done after load event end.
| Content | Transfer Size | Requests |
|---|---|---|
| html | 0 b | 0 |
| css | 0 b | 0 |
| javascript | 0 b | 0 |
| image | 0 b | 0 |
| font | 0 b | 0 |
| favicon | 631 B | 1 |
| Total | 631 B | 1 |
Includes requests done after DOM content loaded.
| Content | Transfer Size | Requests |
|---|---|---|
| html | 0 b | 0 |
| css | 0 b | 0 |
| javascript | 225.8 KB | 3 |
| image | 0 b | 0 |
| font | 0 b | 0 |
| plain | 452 B | 3 |
| favicon | 631 B | 1 |
| Total | 226.9 KB | 7 |
Render blocking information directly from Chrome.
| Blocking | In body parser blocking | Potentially blocking |
|---|---|---|
| 1 | 1 | 1 |
| URL | Type |
|---|---|
| https://www.googleta...nager.com/gtag/js | non_blocking |
| https://www.googleta...nager.com/gtag/js | non_blocking |
| https://www.googleta...nager.com/gtag/js | potentially_blocking |
| https://www.googleta...nager.com/gtag/js | non_blocking |
| https://www.anticsto...lar-webfont.woff2 | non_blocking |
| https://www.google-a....com/analytics.js | non_blocking |
| https://www.anticsto...lic-webfont.woff2 | non_blocking |
| https://www.anticsto...lar-webfont.woff2 | non_blocking |
| https://www.anticsto...s/css-V24-min.css | blocking |
| https://www.anticsto...ss/icomoon2.woff2 | non_blocking |
| https://www.anticsto...m/js/js-V2-min.js | in_body_parser_blocking |
Download the Chrome trace log and drag and drop it into Developer Tools / Performance in Chrome.
Collected using the Long Task API. A long task is a task that take 50 milliseconds or more.
| Type | Quantity | Total duration (ms) |
|---|---|---|
| Total Blocking Time | 165 | |
| Max Potential First Input Delay | 140 | |
| Long Tasks before First Paint | 0 | 0 |
| Long Tasks before First Contentful Paint | 0 | 0 |
| Long Tasks before Largest Contentful Paint | 0 | 0 |
| Long Tasks after Load Event End | 3 | 315 |
| Total Long Tasks | 3 | 315 |
CPU last long task happened at 505 ms
| name | startTime | duration | containerId | containerName | containerSrc | containerType |
|---|---|---|---|---|---|---|
| self | 247 | 140 | window | |||
| self | 390 | 90 | window | |||
| self | 505 | 85 | window |
Calculated using Tracium.
| Categories (ms) | |
|---|---|
| parseHTML | 10 |
| styleLayout | 42 |
| paintCompositeRender | 3 |
| scriptParseCompile | 1 |
| scriptEvaluation | 438 |
| garbageCollection | 7 |
| other | 67 |
| Events (ms) | |
|---|---|
| v8.run | 363 |
| RunTask | 55 |
| FunctionCall | 38 |
| Layout | 33 |
| RunMicrotasks | 19 |
| Tool/domain | Time (ms) |
|---|---|
| Google Tag Manager | 401.3 |
| Google Analytics | 20.3 |
Third party requests categorised by Third party web version 0.26.2.
| Category | Requests |
|---|---|
| tag-manager | 4 |
| survelliance | 8 |
| analytics | 4 |
| Category | Number of tools |
|---|---|
| tag-manager | 1 |
| survelliance | 2 |
| analytics | 1 |
Calculated using .*anticstore.* (use --firstParty to configure).
| Content | Header Size | Transfer Size | Content Size | Requests |
|---|---|---|---|---|
| html | 0 b | 0 b | 0 b | 0 |
| css | 0 b | 8.7 KB | 41.7 KB | 1 |
| javascript | 0 b | 3.3 KB | 16.9 KB | 1 |
| image | 0 b | 67.2 KB | 66.0 KB | 7 |
| font | 0 b | 62.6 KB | 61.2 KB | 4 |
| favicon | 0 b | 631 B | 1.1 KB | 1 |
| Total | N/A | 145.7 KB | 197.6 KB | 15 |
| Content | Header Size | Transfer Size | Content Size | Requests |
|---|---|---|---|---|
| html | 0 b | 0 b | 0 b | 0 |
| css | 0 b | 0 b | 0 b | 0 |
| javascript | 0 b | 428.7 KB | 1.2 MB | 5 |
| image | 0 b | 0 b | 0 b | 0 |
| font | 0 b | 0 b | 0 b | 0 |
| plain | 0 b | 452 B | 1 B | 3 |
| Total | N/A | 429.1 KB | 1.2 MB | 8 |
Axe is an accessibility testing engine for websites and other HTML-based user interfaces. Tested using axe-core version 4.10.2. Read more about axe-core .
Median number of violations for all the runs. Check each individual run to see all the violations.
| Type | Violations (median) |
|---|---|
| Critical | 1 (1 issues) |
| Serious | 2 (17 issues) |
| Moderate | 2 (11 issues) |
| Minor | 1 (2 issues) |